.png?width=365&height=50&name=Texada%20Logo%20(Black).png)
In This Article
Leads & Opportunities
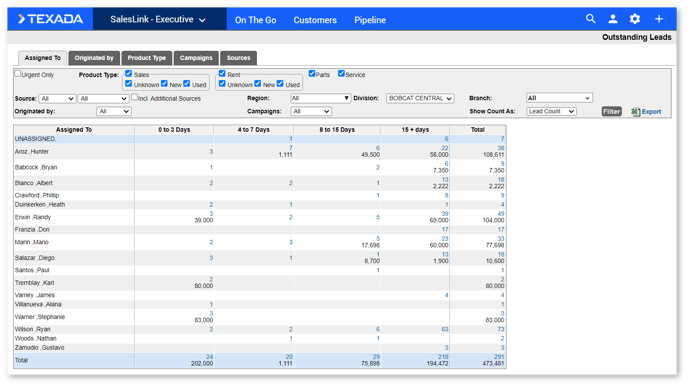
Outstanding Leads
This report shows all leads that have not been acted on, or in other words, are still in the first stage of Lead. It details the age of leads into buckets of 0 to 3 Days, 4 to 7 Days, 8 to 15 Days and 15+ days. Within these columns, the report displays the number and value of leads. This report can be viewed by Assigned To, Originated By, Product Type, Campaigns and Sources. Each drillable view of this report can be exported to Excel.
SalesLink Executive → On The Go → Outstanding Leads
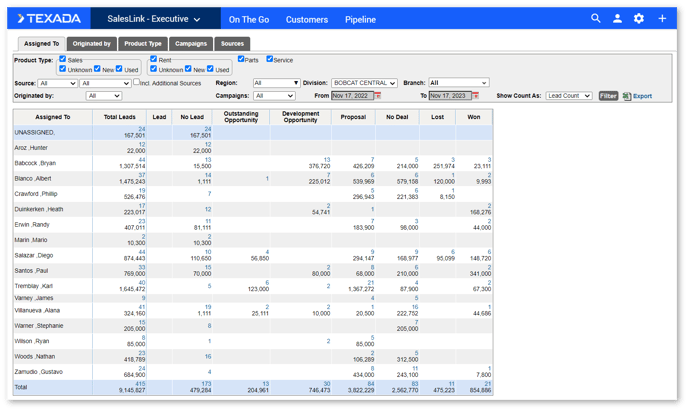
Resolved Leads
This report shows all leads and opportunities when they are no longer in the Lead stage, and displays data (number and $ value of leads) in 7 lead/opportunity stages (No Lead, Outstanding, Development, Proposal, No Deal, Lost and Won), and can be viewed by Assigned To, Originated By, Product Type, Campaigns and Sources. Each drillable view of this report can be exported to Excel.
SalesLink Executive → Pipeline → Resolved Leads
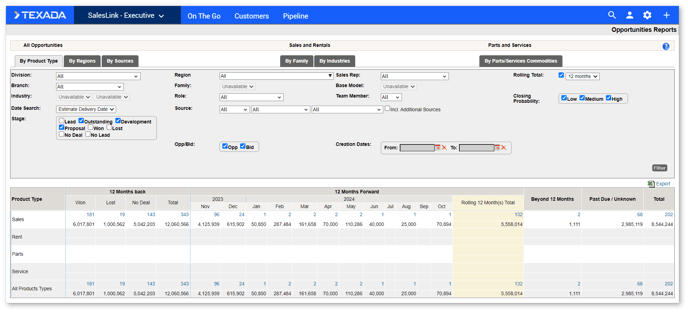
Opportunity Pipeline
This report provides a timeline view of all leads and opportunities. 12 Months Back shows all leads and opportunities that were either Won, Lost or No Deal, and 12 Months Forward shows all leads and opportunities by month. The data in each cell shows the number and $ value of leads, and is drillable. This report can be viewed by Product Type, Regions, Sources, Family, Industries and Commodities. Each drillable view of this report can be exported to Excel.
SalesLink Executive → Pipeline → Opportunity Pipeline
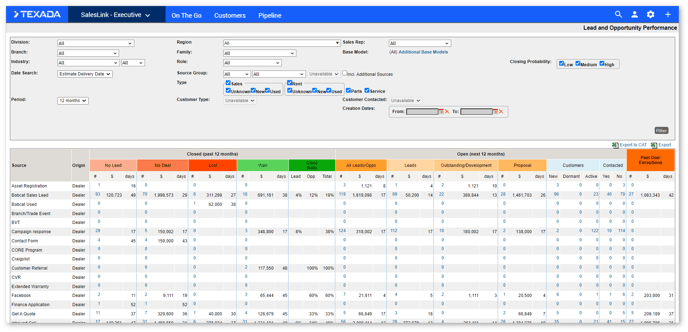
Lead and Opportunity Performance
This report provides a different view of the same data that it is used in the Opportunity Pipeline report. It was originally created for exporting based on OEM requirements, but has since been updated. In the Past 12 Months section, there are 2 additional columns, one for No Lead, and one for Close Ratio. As well, in the No Lead, No Deal, Lost and Won area, there is a column for average days open. In the Open (Next 12 Months) section, there are 4 areas (All Leads/Opps, Leads, Outstanding/Development and Proposal) which also show the number of Leads/Opportunities, the total $ value and the average days open. There are also 2 columns that show the number of customers on that row, and whether they have been contacted (not contacted = no Activities on the account). This report is viewable by sales rep and product family.
SalesLink Executive → Pipeline → Lead and Opportunity Performance
Activities and Customer Coverage
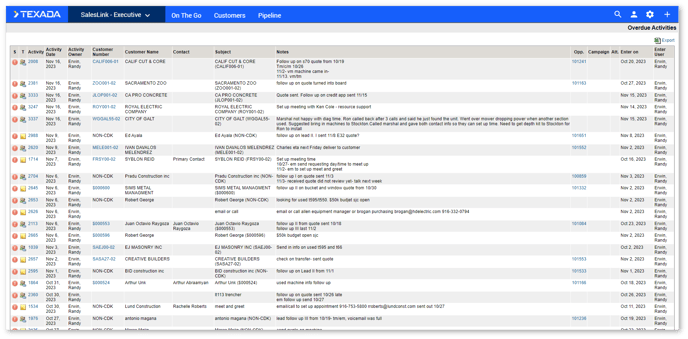
Overdue Activities
This report allows you to drill down to all Overdue Activities by sales rep. The view includes sortable columns for Activity Number, Activity Date, Activity Owner, Customer Number, Customer Name, Contact, Subject, Notes Opportunity Number, Campaign, Attachment, Enter Date and Enter User. Data in the Activity Number, Customer Number and Opportunity Number are all drillable. Each drillable view of this report can be exported to Excel.
SalesLink Executive → On The Go → Overdue Activities → Region → Rep Total
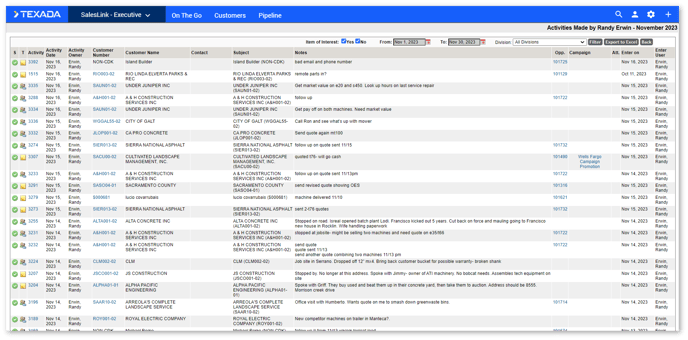
Made Activities
This report, which allows you to drill down to all Made Activities by sales rep, is very similar to the Overdue Activities report, with the exception that it’s for made activities and provides a 12 Months Back or Annual view. The view includes sortable columns for Activity Number, Activity Date, Activity Owner, Customer Number, Customer Name, Contact, Subject, Notes Opportunity Number, Campaign, Attachment, Enter Date and Enter User. Data in the Activity Number, Customer Number and Opportunity Number are all drillable. Each drillable view of this report can be exported to Excel.
SalesLink Executive → Customer → Made Activities → Region → Rep Month or Total
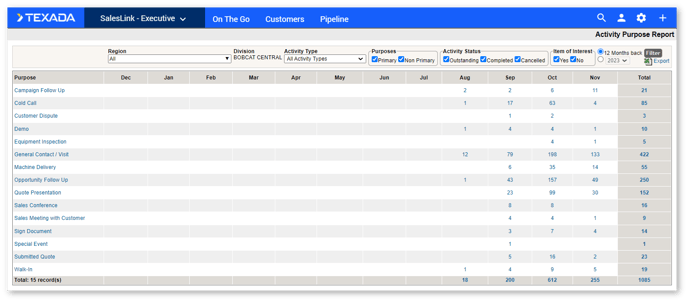
Activities By Purpose
This report allows you to drill down to all Activities, both Overdue and Completed, by Activity Purpose. The main view provides a 12 Months Back or Annual view, and can be filtered by Activity Type. Data in the Month column are all drillable. Each drillable view of this report can be exported to Excel.
SalesLink Executive → Customers → Activities By Purpose
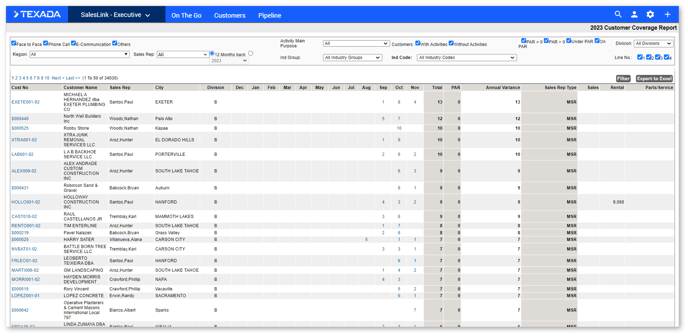
Customer Coverage
This report provides a view of all Activities by customer, and compares them to the PAR value if set. The report can be filtered by sales rep, and can be viewed as 12 Months Back or Annual. The values in the Month columns are drillable. The main page of the report, and each drillable view, can be exported to Excel. Please note that the main page of the report defaults to the first sales rep alphabetically. Selecting All or a particular rep in the Sales Rep dropdown provides a more directed view.
SalesLink Executive → Customer → Customer Coverage