
Quick Reference
- Power BI Service is a cloud-based, in-browser application available at app.powerbi.com. This application provides business users with a number of powerful tools for viewing and modifying reports.
- To log in to Power BI Service, navigate to app.powerbi.com and input the Microsoft credentials provided to you during the Texada Analytics set-up process.
- All of the content in Power BI such as reports, datasets, and dashboards is organized into workspaces. To browse the workspaces to which you have access, click “Workspaces” in the left navigation menu.
- To view and edit an existing report:
- Open the workspace containing the report you’d like to view and click on it to select it. This will open the report in Reading view.
- If you have editing permissions for the report, you can now click on the Edit button in the top menu bar to switch to Editing view.
- Click the save button in the top-right corner of the screen to save the report once you are finished.
- To create a new report:
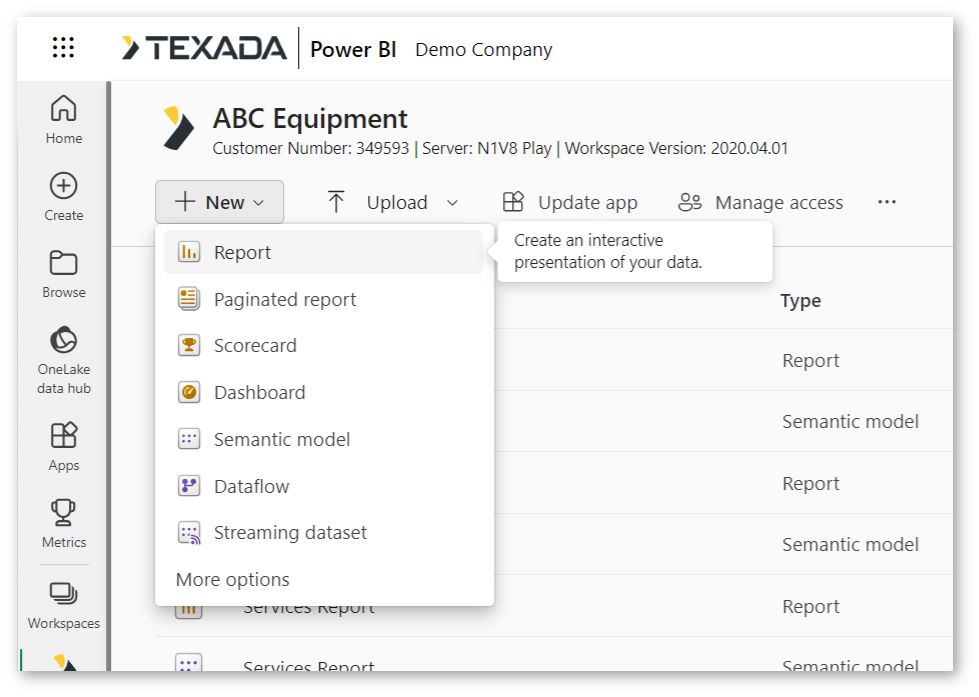
- Open the workspace to which you’d like to add a new report. Click the “New” button near the top-left corner of the screen, then select “Report”.
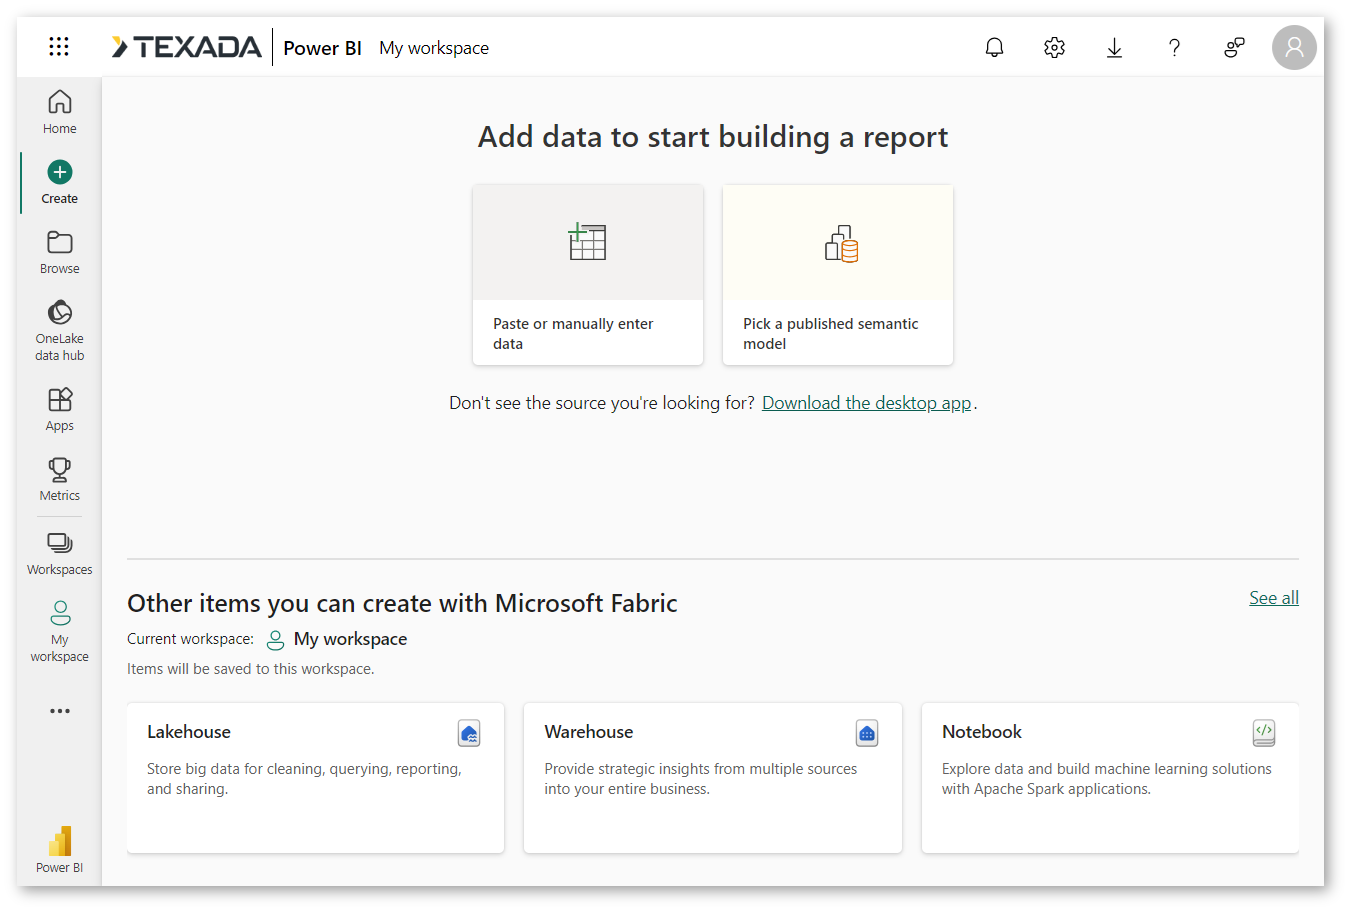
- Select “Pick a published semantic model”.
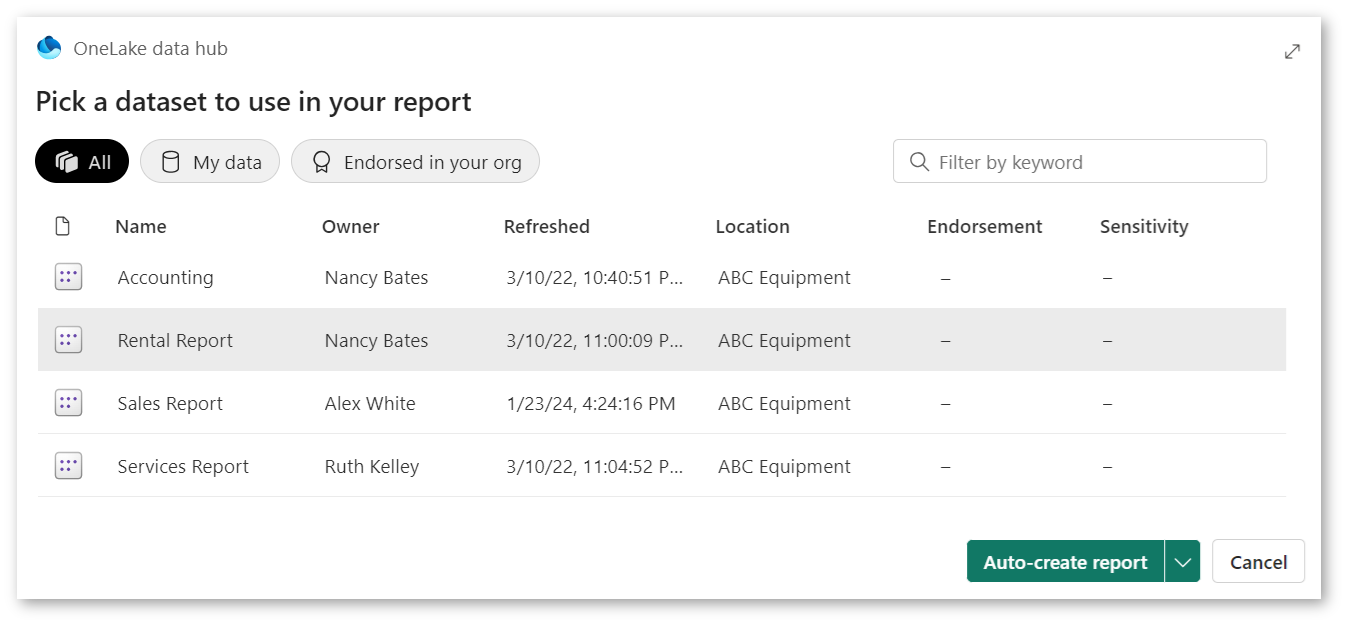
- Select the dataset you wish to use for your new report, then click the drop-down arrow next to the create button and select “Create a blank report”.
- Once you are finished editing your new report, click the save button in the top-right corner of the screen to save it.
- To share a report:
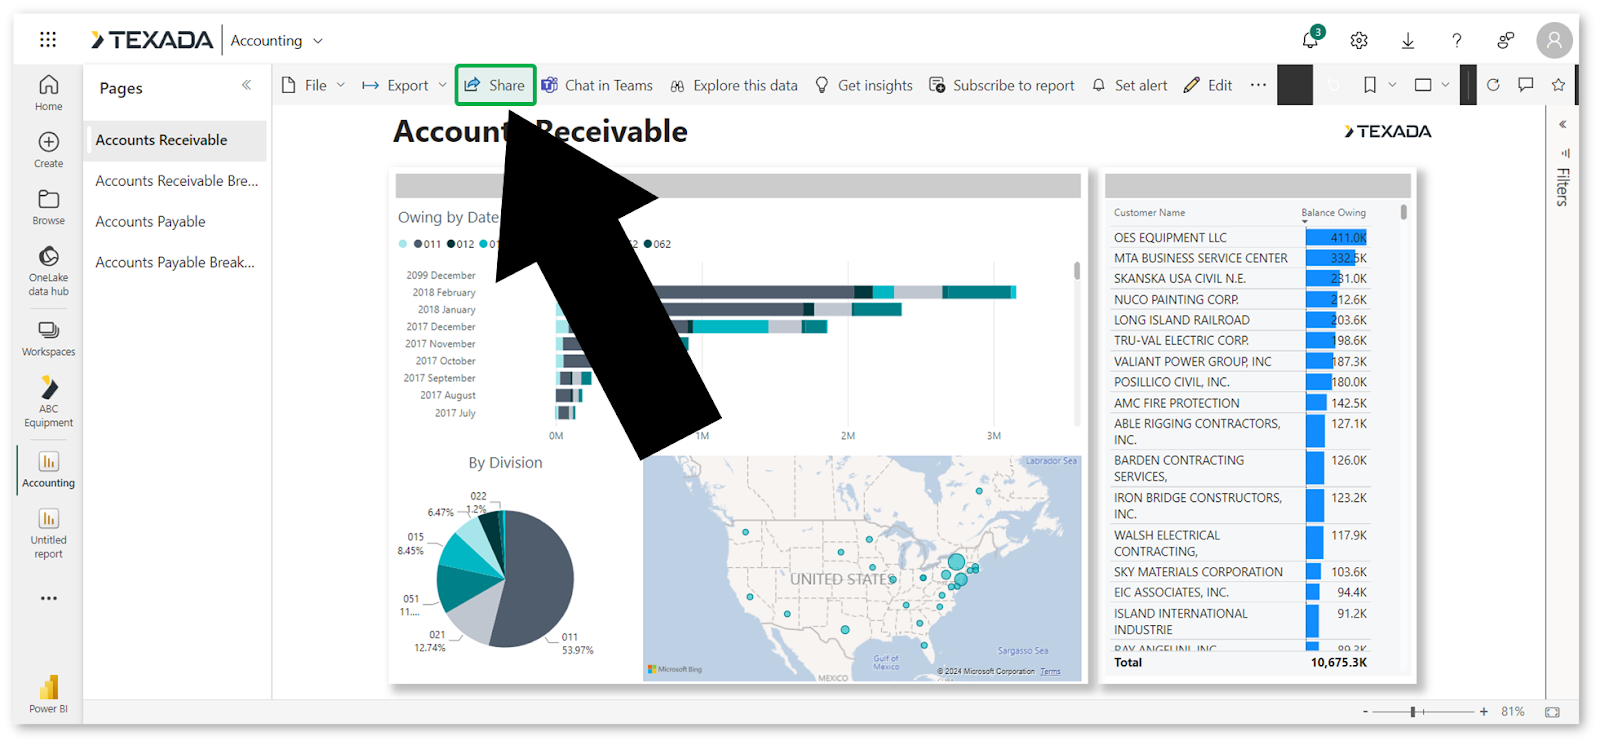
- Open the report you’d like to share and click the “Share” button in the top menu bar to open the Send Link window.
- Select the desired privacy and sharing options, enter a list of recipients from within your organization, and click “Send”. Alternatively, select one of the additional sharing options at the bottom of the Send Link window.
- To export a report:
- Open the report you’d like to export and click the “Export” button in the top menu.
- Select whether to export the report as an Excel file (.xlsx), PowerPoint file (.pptx), or PDF document (.pdf).
- To subscribe to a report:
- Open the report to which you’d like to subscribe and click the “Subscribe to report” button in the top navigation menu.
- Select “New subscription” or “Create a subscription”.
- Input the information for your subscription including the list of recipients, frequency and timing, then click “Save”.
In This Article
Introduction
Power BI Service is one of three Power BI applications that can be used to access Texada Analytics. This is a cloud-based, in-browser application available at app.powerbi.com. This application provides business users with a number of powerful tools for viewing and modifying reports.
Logging In
A Microsoft account is needed to access Power BI. Your account credentials will be provided by a Texada representative during the set up process.
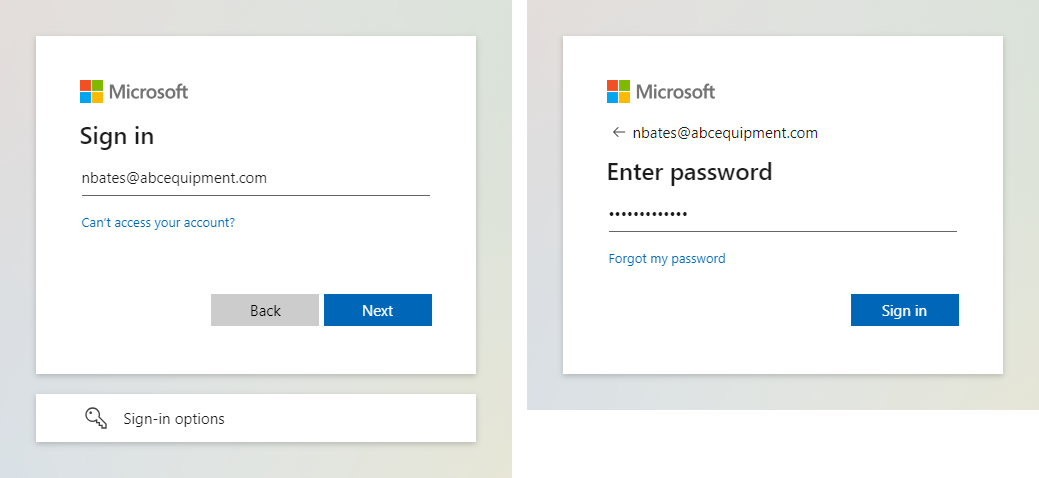
To log in to Power BI service, follow the steps below.
- Open your web browser and navigate to app.powerbi.com.
- Enter the Microsoft email address and password provided to you by Texada staff and click “Sign in”.
- Upon a successful login to the Power BI service, you will be redirected to the Power BI home page.
Navigation
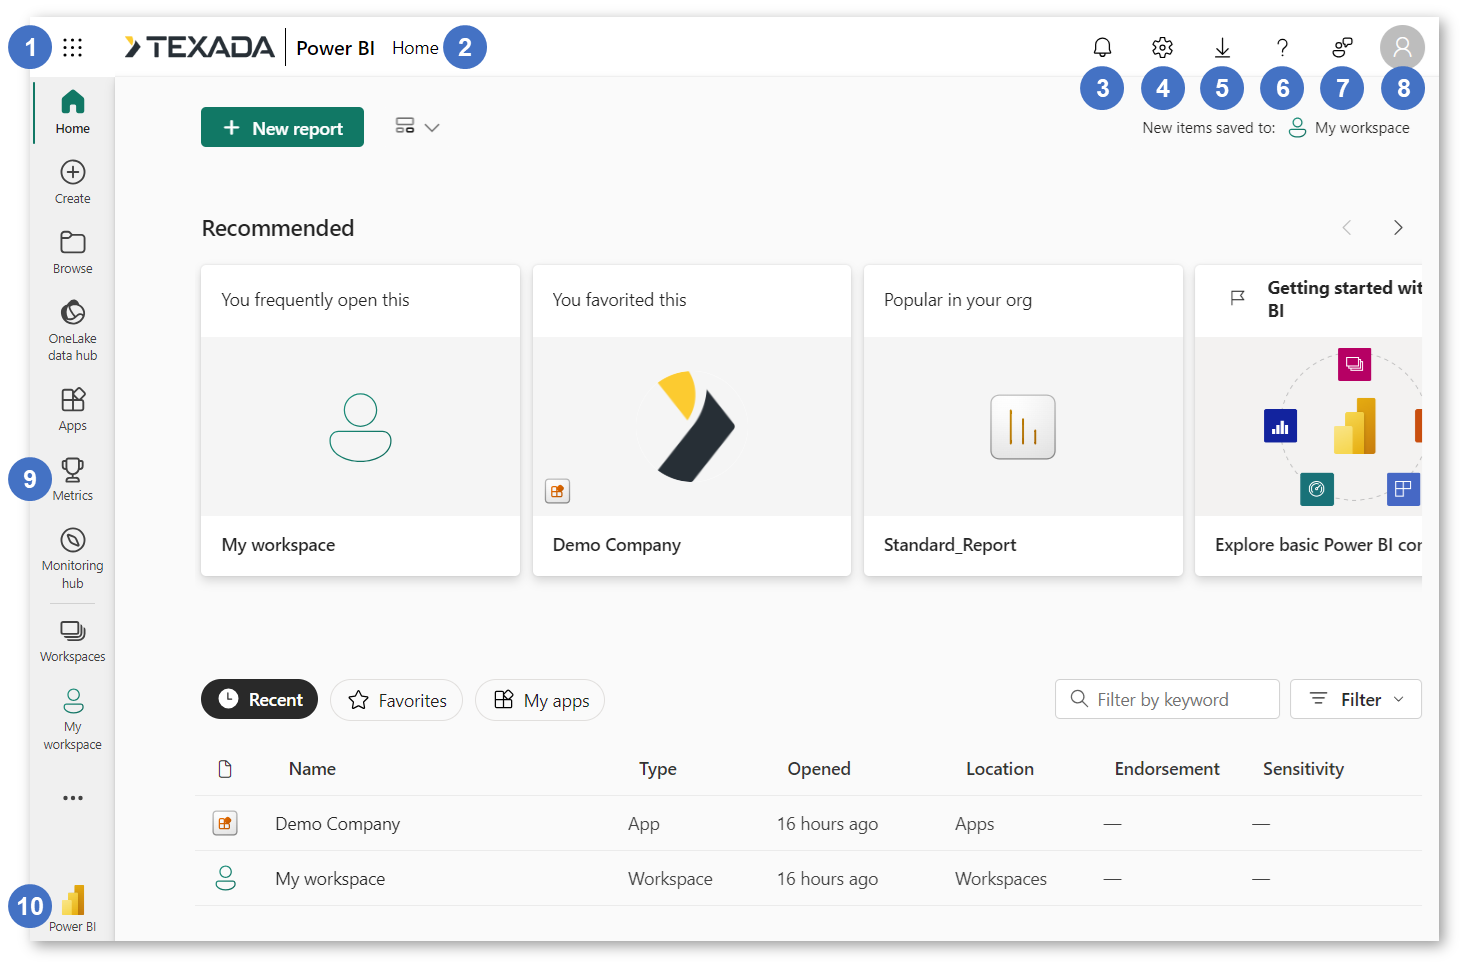
- Apps Menu
Click to explore additional Microsoft 365 applications. - Current Page / Return to Home
Displays your current page. Click the Texada | Power BI logo to return to the home page. - Notifications
Click the bell icon to view notifications. - Settings
Click the gear icon to view the settings menu, including Preferences, Resources and extensions, and Governance and insights. - Downloads
Click the downloads icon to download additional software, including Power BI Desktop and Power BI for Mobile. - Help
Click the question mark icon to access Microsoft’s help resources. Please note that this is a Microsoft feature and is not managed by Texada staff. - Feedback
Click to submit feedback to Microsoft. Please note that this is a Microsoft feature and has no connection to Texada staff. - User Profile
Click the profile icon to access information about your Microsoft account, including your current license type. You can also sign out of Power BI via the “Sign out” button. - Navigation Menu
Contains links to the various pages within Power BI Service. As you continue to use Power BI, links to recently-accessed reports will also appear in this menu.- Home: The landing page of Power BI Service. Contains recommended links, recent pages, and favorites.
- Create: Import data and create new reports.
- Browse: Browse existing reports, workspaces, and apps.
- OneLake Data Hub: Paid Microsoft feature. Allows you to explore and manage data from across your organization.
- Apps: Contains a list of apps for your organization. An app is a series of dashboards and reports that have been bundled into a single mini-application. When you first access Texada Analytics, you should have access to an app with your company name. This is a consolidated view of all of the out-of-the-box reports that Texada Analytics provides.
- Metrics: A tool for tracking business metrics.
- Monitoring Hub: View and track the status of activities across all workspaces.
- Deployment Pipelines: Allows you to create deployment pipelines for publishing your data.
- Learn: Contains a series of resources for learning more about Power BI. Please note that these resources are maintained by Microsoft and have no affiliation with Texada.
- Workspaces: Click to open the Workspaces panel, which allows you to quickly browse and switch between workspaces.
- My Workspace: Click to access your workspace.
- Microsoft Fabric Apps
Click to switch between various Microsoft Fabric applications.
Exploring Workspaces
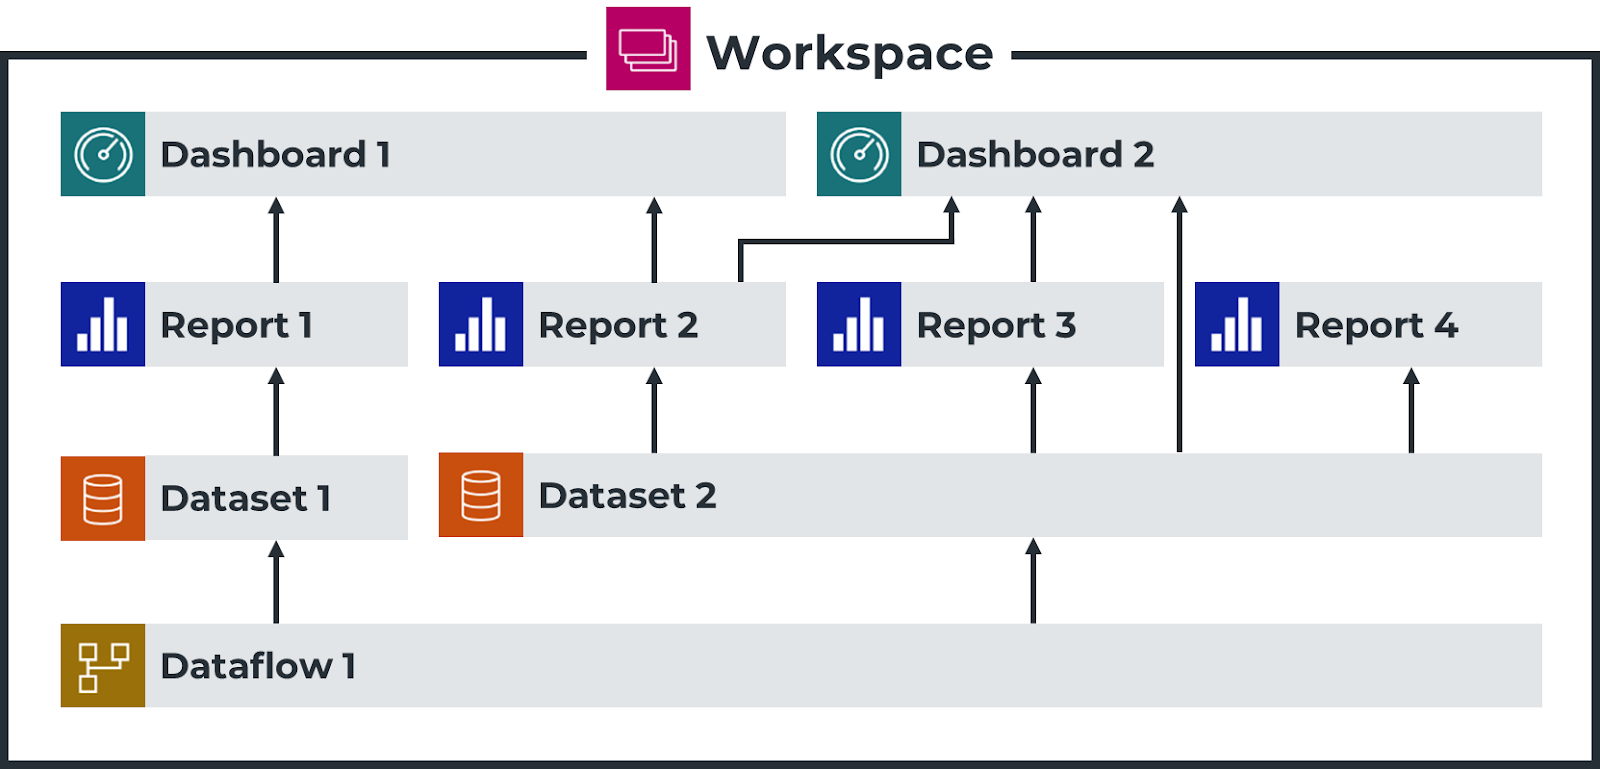
All of the content in Power BI such as reports, datasets, and dashboards is organized into workspaces. The standard method of managing workspaces for your organization is to create a separate workspace for each department. This is because permissions allowing access to reports are set at the workspace level.
Click “Workspaces” in the left navigation menu of Power BI Service to open the Workspaces panel. This panel allows you to browse the workspaces to which you have access.
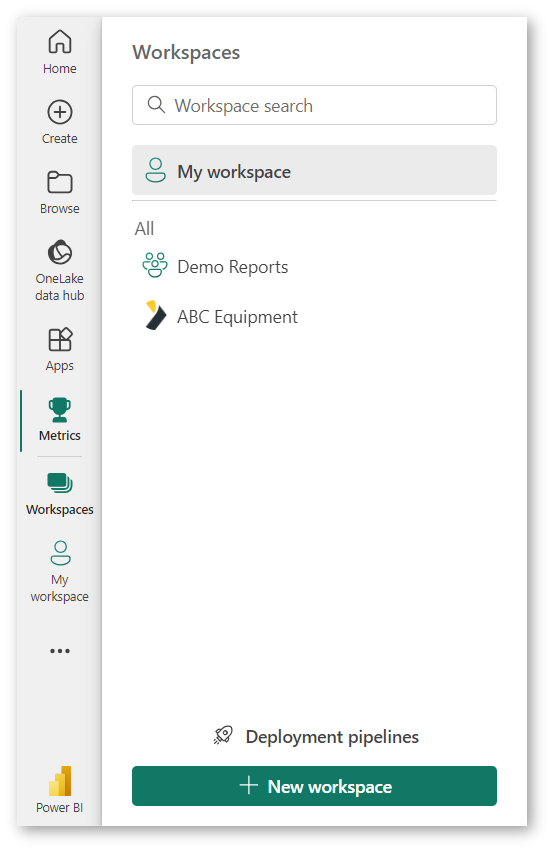
Begin typing into the search bar to filter the list of workspaces. Click on a workspace to access it.
You can also access your own personal workspace by clicking “My workspace” in the left navigation menu.
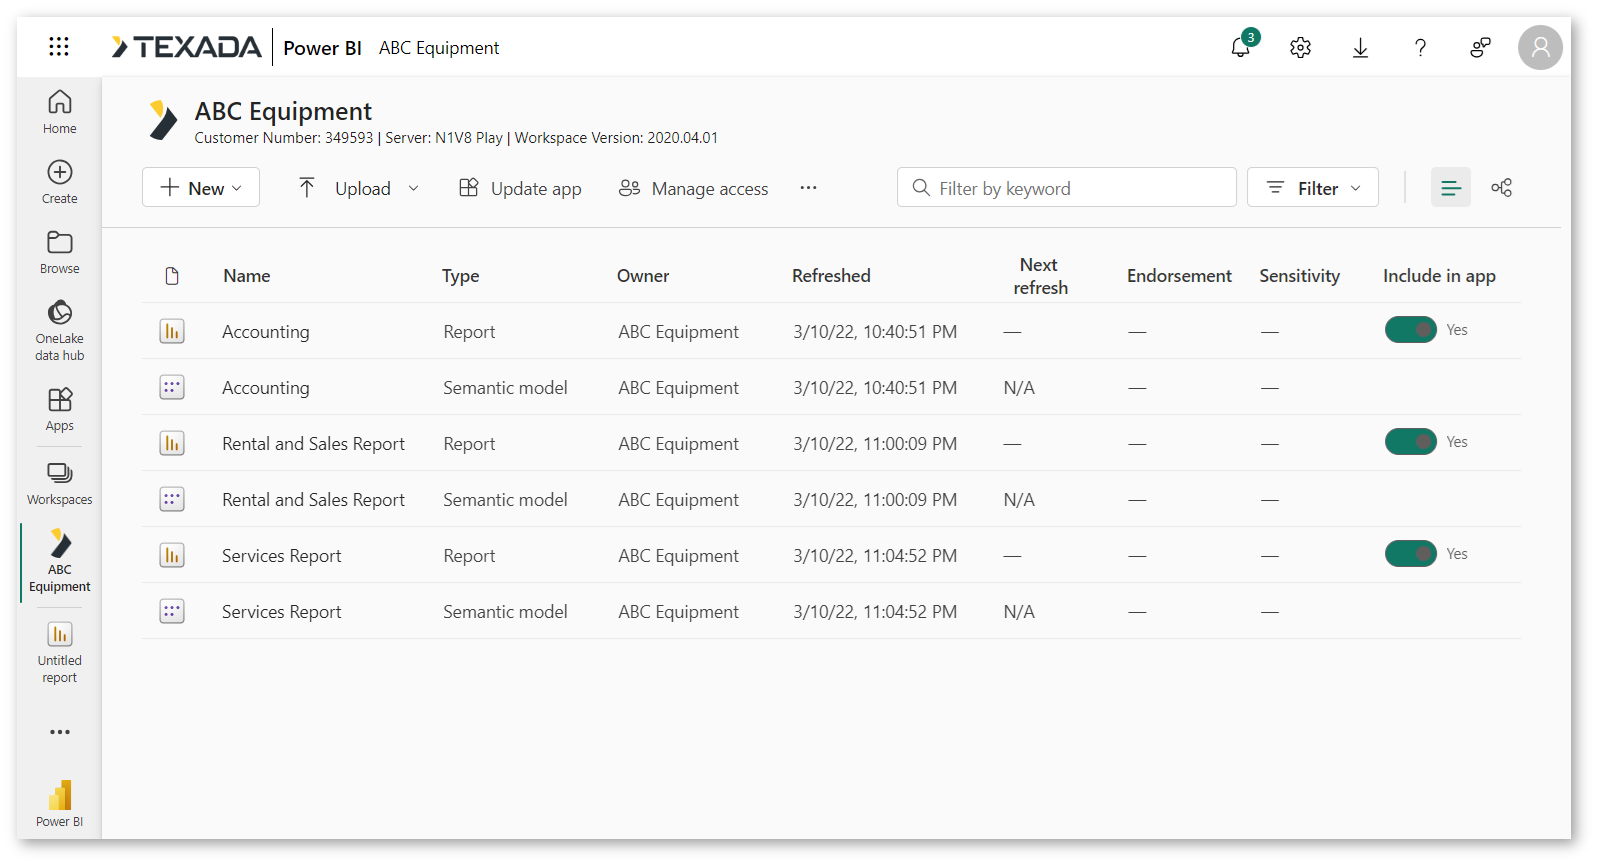
Once you have opened a workspace, you can browse the various reports and semantic models that comprise it. Use the icons in the top-right corner to switch between list view and lineage view
.
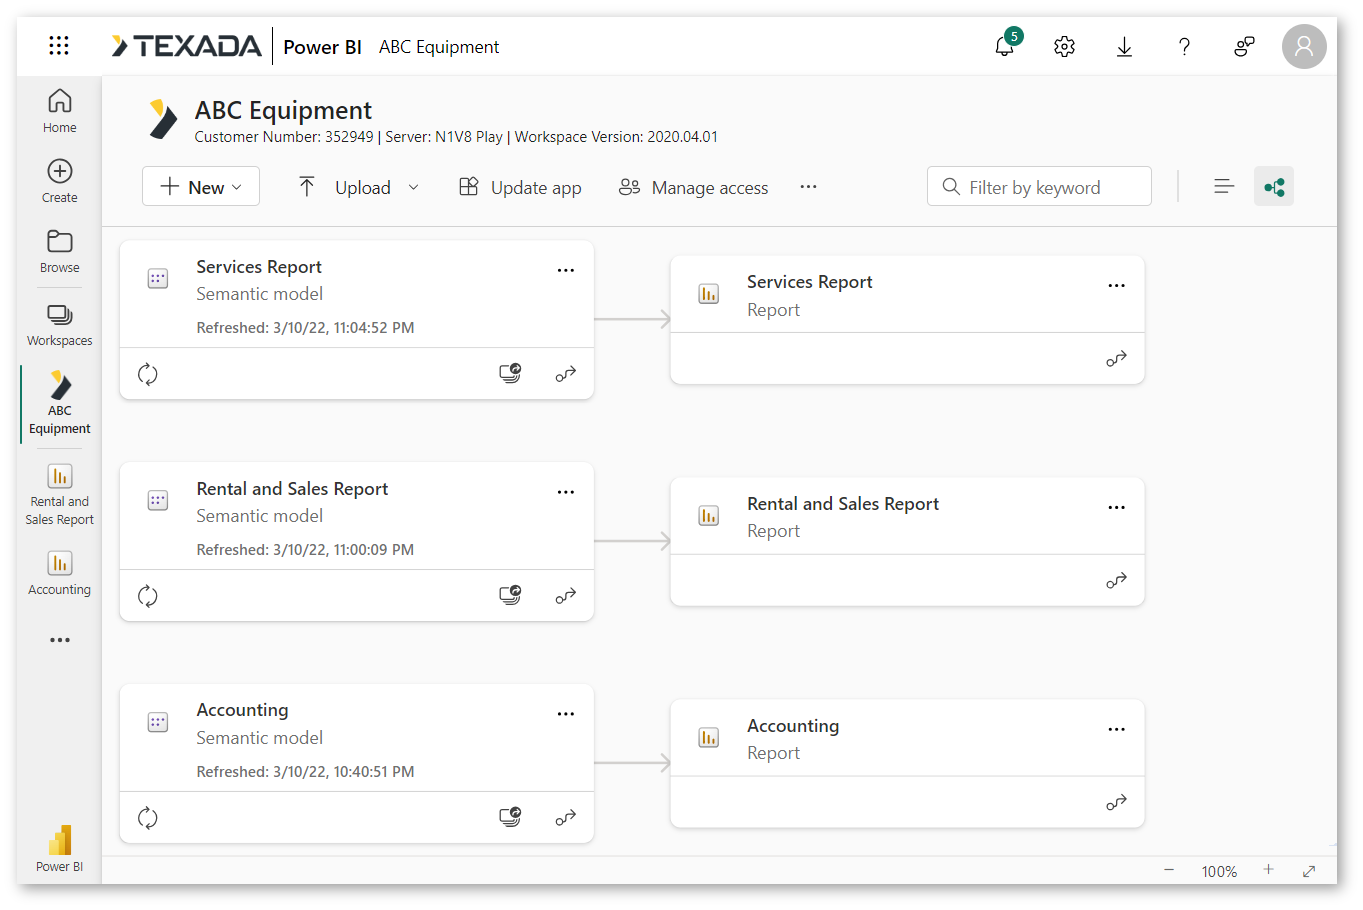
Reports
View and Edit a Report
There are two modes to interact with a report in Power BI Service: Reading view and Editing view. When you first open a report, it will open in Reading view. If you have sufficient permissions, you will then be able to switch to Editing view to modify the report.
To view and edit a report in Power BI Service, follow the steps below.
- Open the workspace containing the report you’d like to view and click on it to select it.
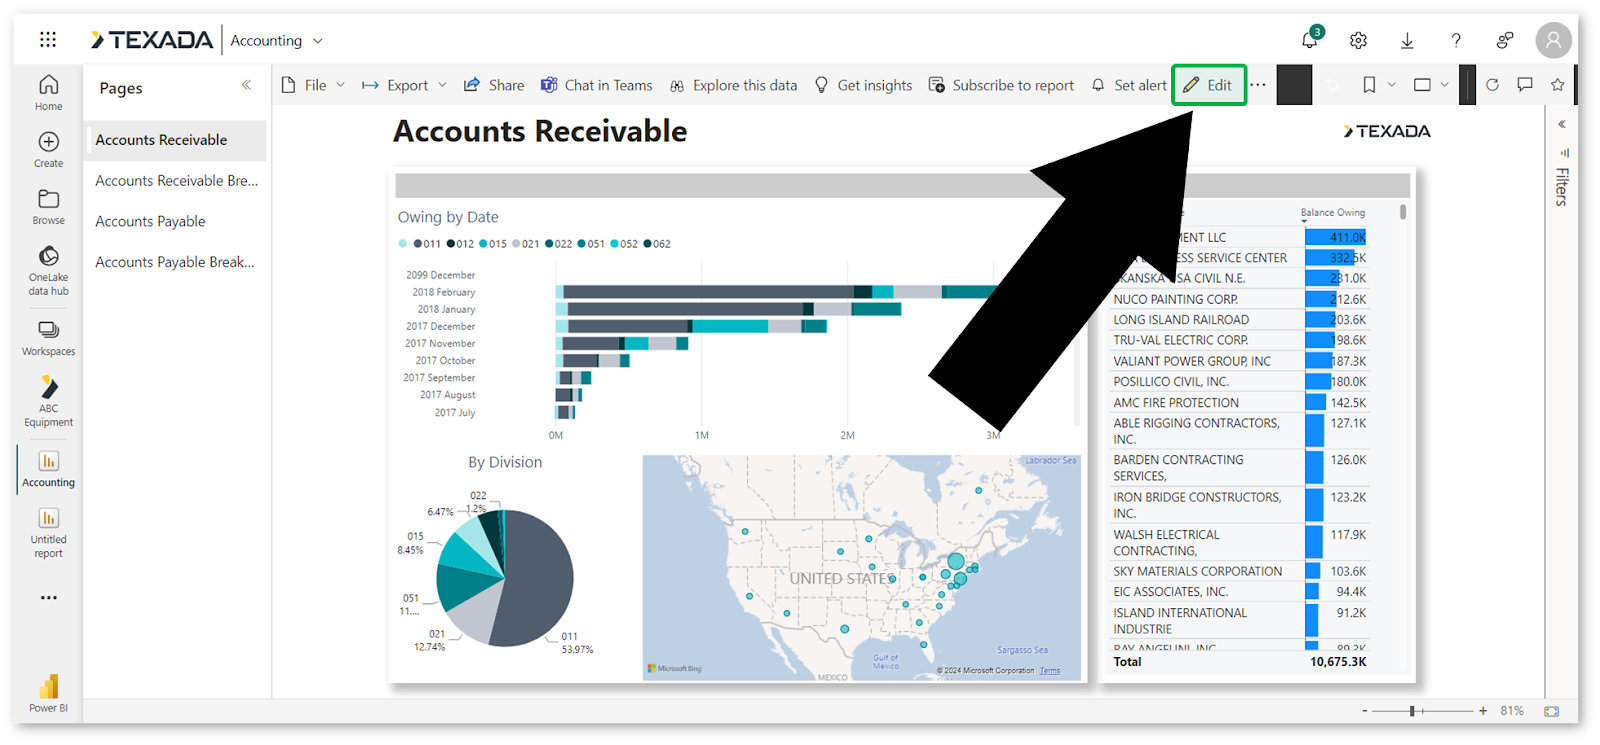
- The report will now open in Reading view. If you have editing permissions for the report, you can now click on the Edit button
in the top menu bar to switch to Editing view.
- You can now edit the report. Once you finished, click the save button
in the top-right corner of the screen to save your changes.
Create a Report
To create a new report in Power BI Service, follow the steps below.
- Open the workspace to which you’d like to add a new report. Click the “New” button near the top-left corner of the screen, then select “Report”.
You can also start a new report by clicking “Create” in the left navigation menu. - Select “Pick a published semantic model”.
- The list of datasets to which you have access will now be displayed. Select the dataset you wish to use for your new report, then click the drop-down arrow
next to the create button and select “Create a blank report”.
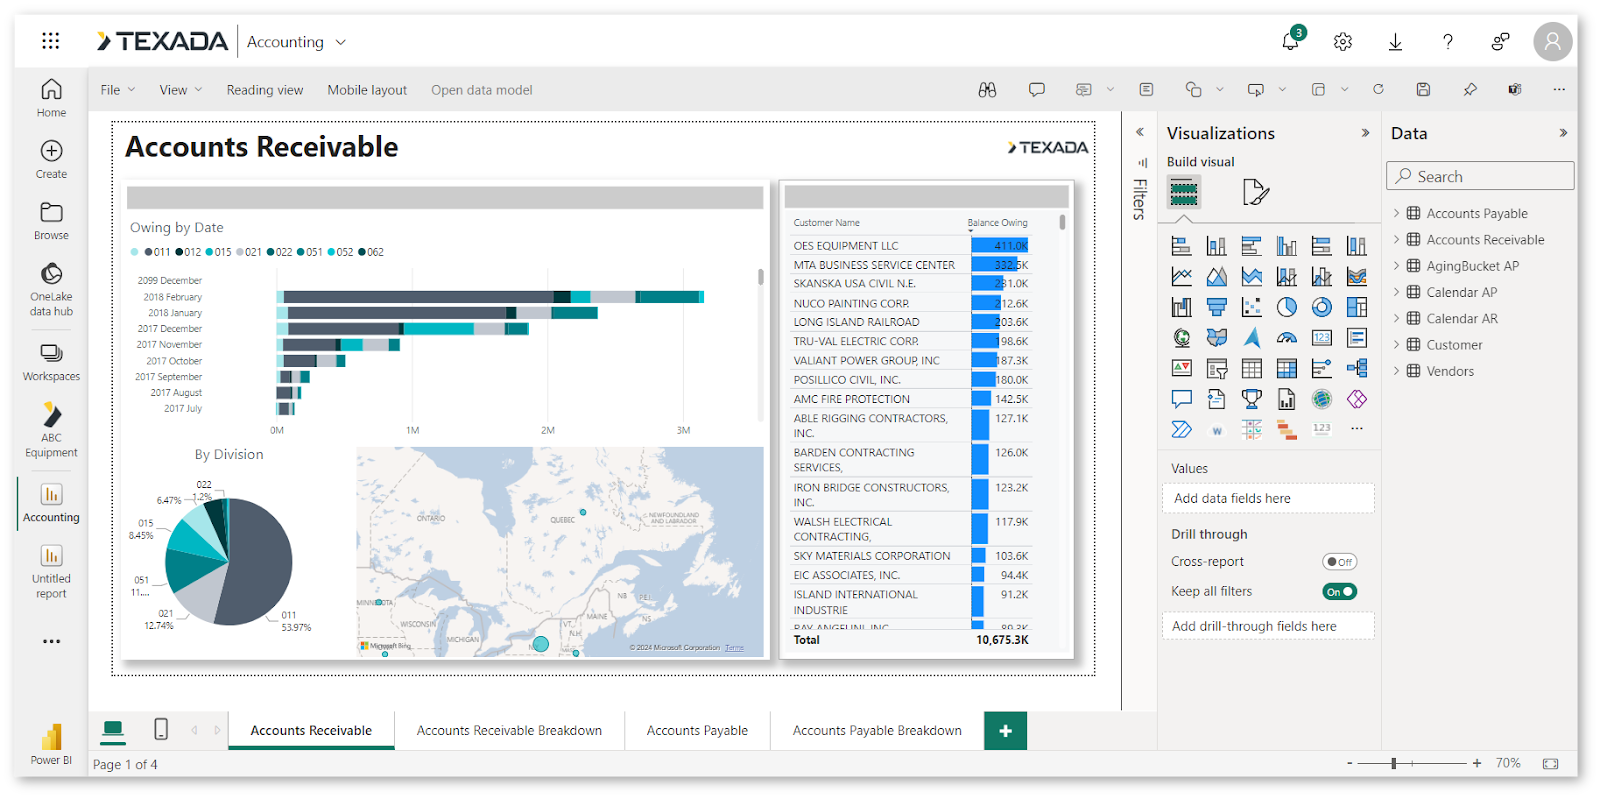
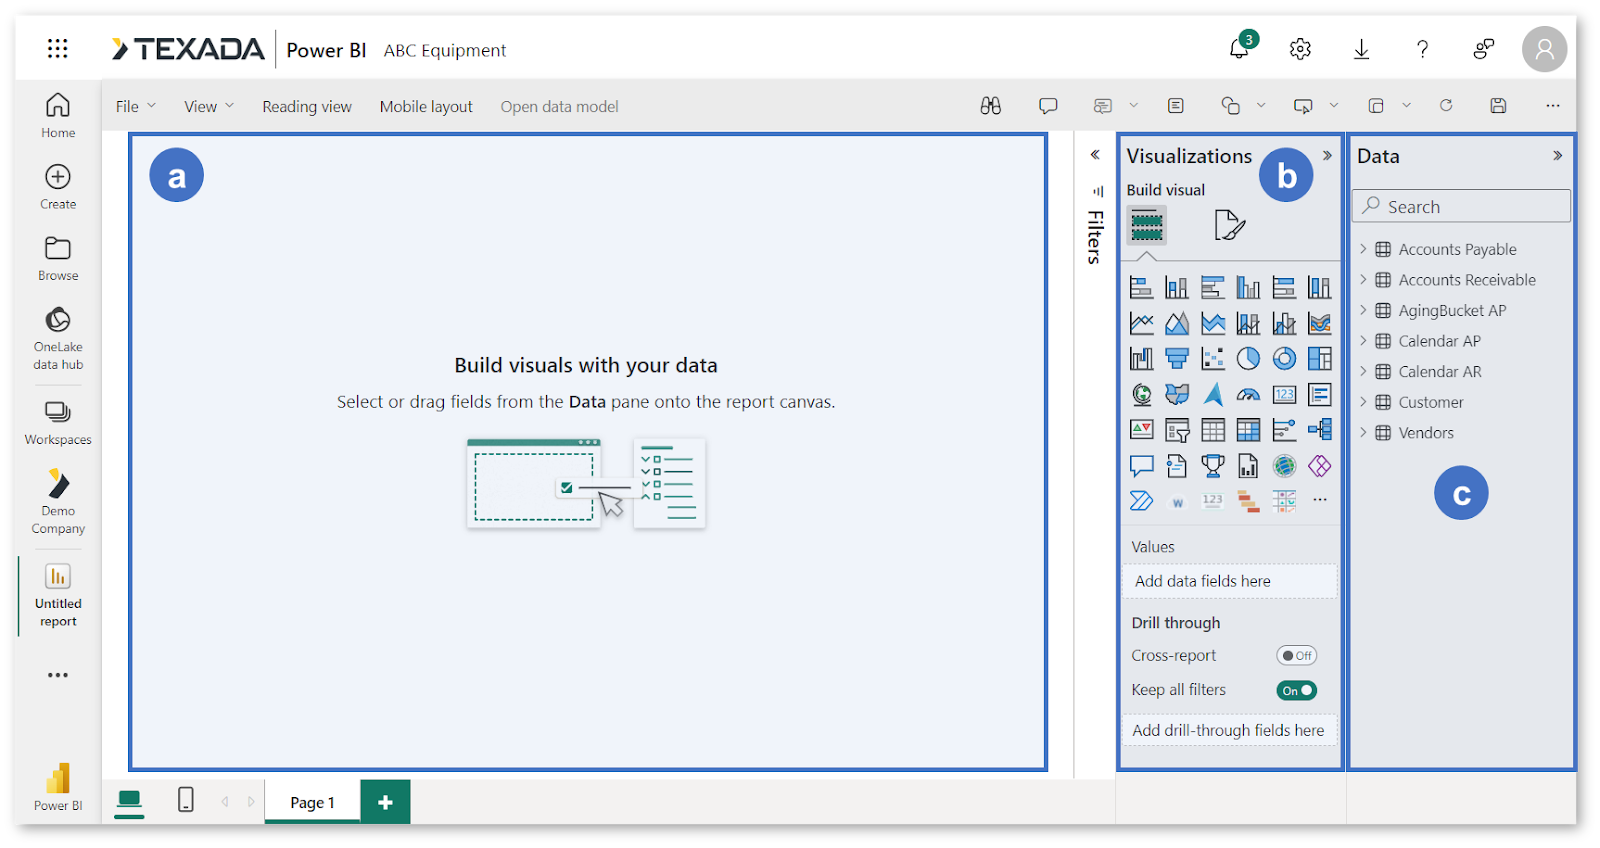
If you instead want Power BI to automatically generate its own report based on the data you selected, click “Auto-create report”. - The report editor will now be displayed. This editor allows you to combine data and visualizations to create reports. It consists of three main areas: the canvas, the Visualizations panel, and the Data panel.
To start building a report, you can either select the relevant fields from your data or pick a visualization to add to the canvas. To add a field to your report, simply click the relevant field in the Data panel. You can also drag and drop fields into the axis, legend, and values areas.- Canvas
This area is blank until visuals are added. - Visualizations Panel
Used to add and edit charts and other data visualizations. - Data Panel
A list of available data fields, determined by the columns present in the dataset you selected in step 3.
- Canvas
- Once you are finished editing your new report, click the save button
Share a Report
To share a report from Power BI Service, follow the steps below.
- Open the report you’d like to share and click the “Share” button
in the top menu bar.
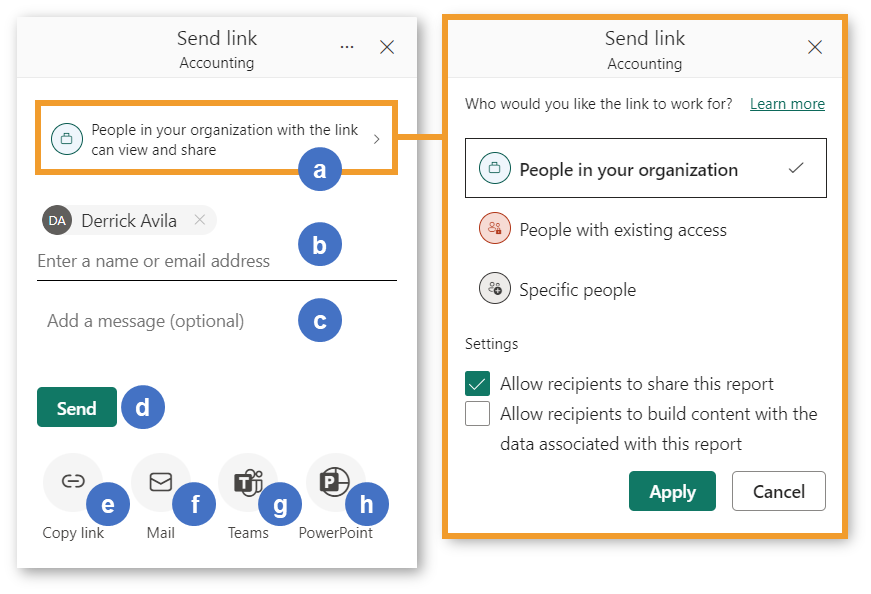
- The Send Link window will now open. This window provides you with a number of options for sharing the report with people inside and outside your organization.
- Privacy Settings
Click to view privacy and sharing settings for the report (right). Using this window, you can select who from your organization is able to view the report using the emailed link. You can also control whether or not recipients can share the report or build content using the data associated with the report. - Recipients
Begin typing a name or email address to view a list of people at your organization with whom the report can be shared. Click on a name to add that person as a recipient.
Only people within your organization can be added using this method. If you want to send this report to someone outside of your organization, use the “Copy link” (e) or “Mail” (f) options below. - Add a Message
Add an optional message for the recipients. - Send Button
Click to email the report to the recipients listed above (b). - Copy Link Button
Click to copy a link to the report to your clipboard. This link can then be shared with people within your organization. Note that the privacy settings established above (a) will still apply. - Mail Button
Click to share the report via an external email program such as Microsoft Outlook. - Teams Button
Click to share the report via Microsoft Teams. - PowerPoint Button
Click to receive an embed link for your report that can be embedded directly into a Microsoft PowerPoint presentation.
- Privacy Settings
Export a Report
To export a report from Power BI Service, follow the steps below.
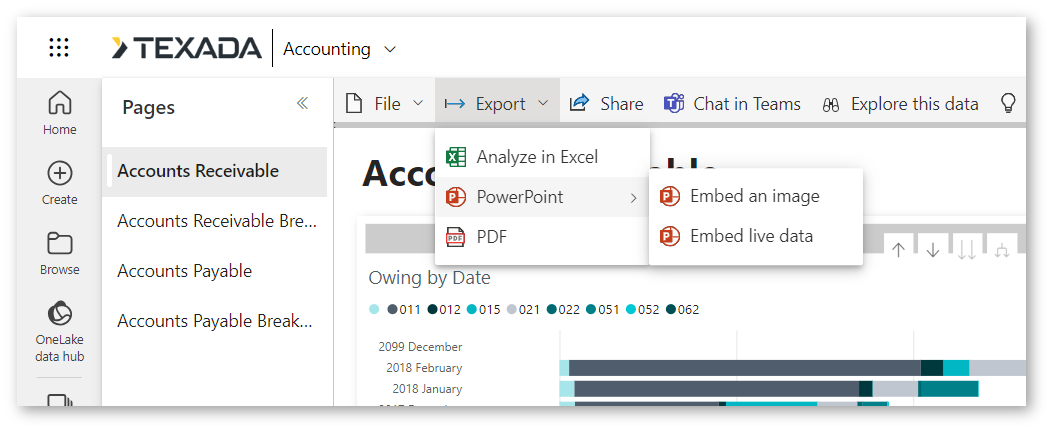
- Open the report you’d like to export and click the “Export” button
in the top menu.
- You can now choose to export the report to Excel (.xlsx), PowerPoint (.pptx), or to a PDF (.pdf). If you choose to export to PowerPoint, you can additionally select between exporting a static image and embedding live data into your presentation.
Subscribe to a Report
To subscript to a report in Power BI Service, follow the steps below.
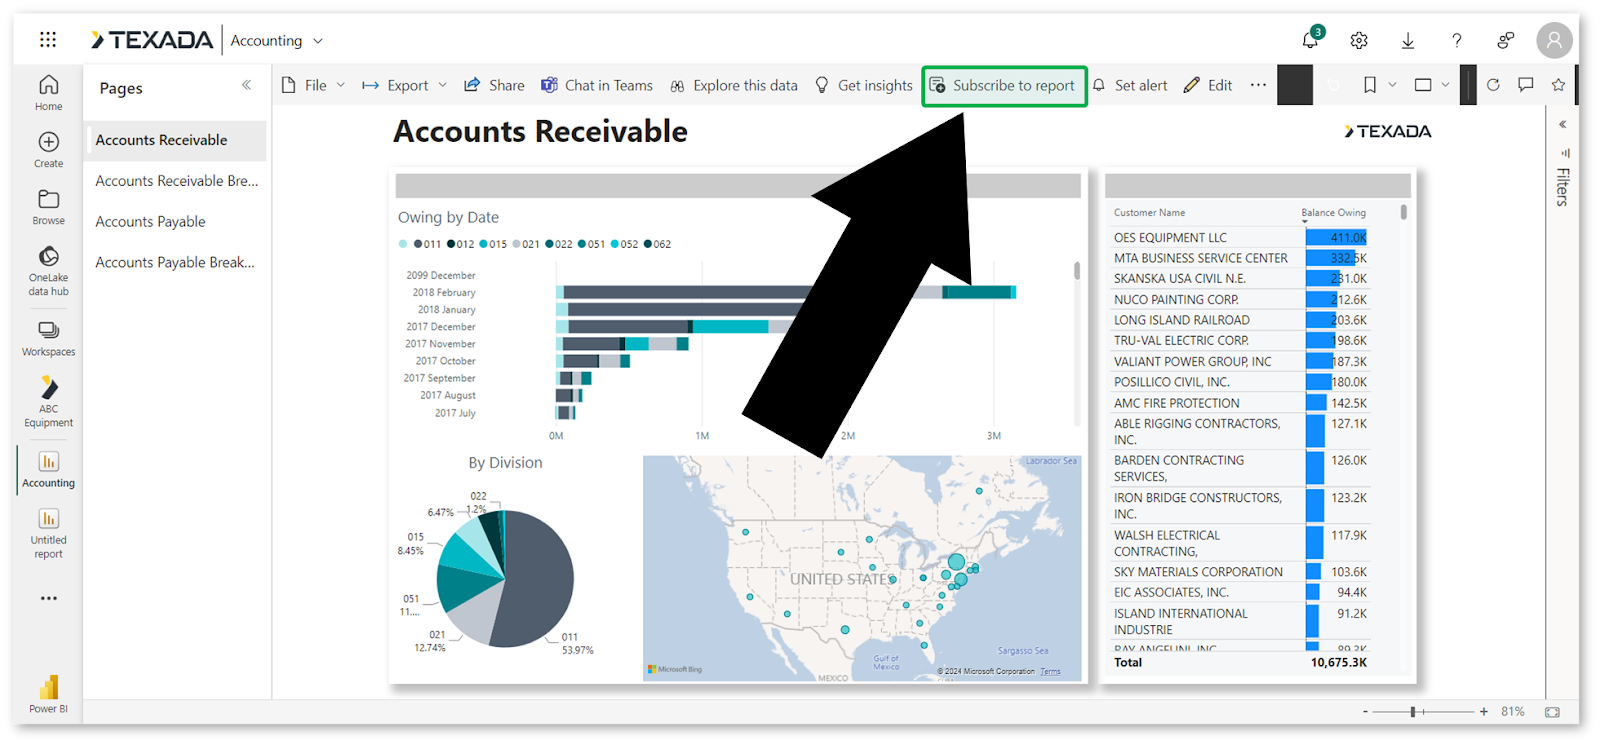
- Open the report to which you’d like to subscribe and click the “Subscribe to report” button
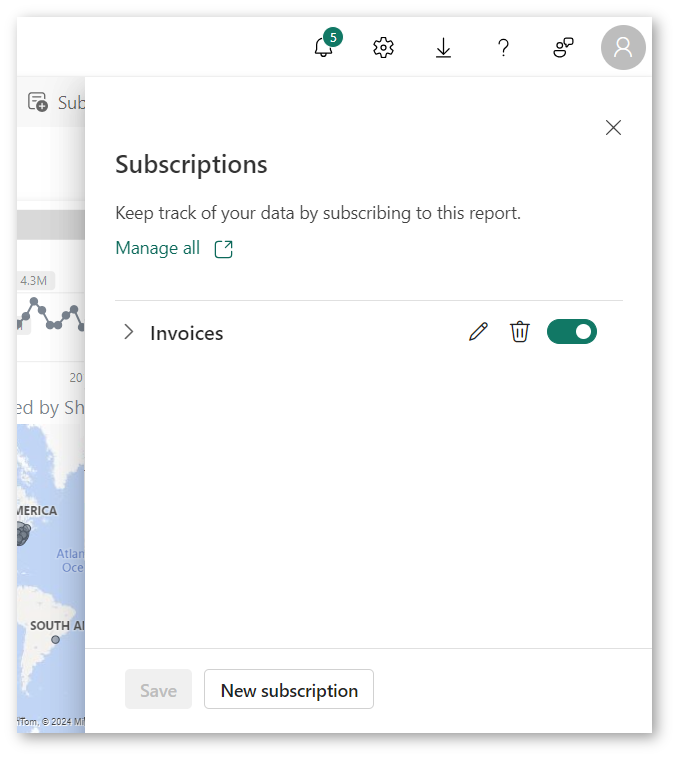
in the top navigation menu to open the Subscriptions panel.
- Click “Create a subscription” if you have no existing subscriptions, or “New subscription” otherwise. You can also click the edit button
next to an existing subscription to modify it.
- Enter the information for your subscription, including the recipients, duration, frequency, and scheduled time of sending. Click the “Send now” button to receive a sample of the emails that will be sent.
- Once you are finished, click the “Save” button. You and the other recipients will now receive an emailed version of the report at the time and frequency specified.
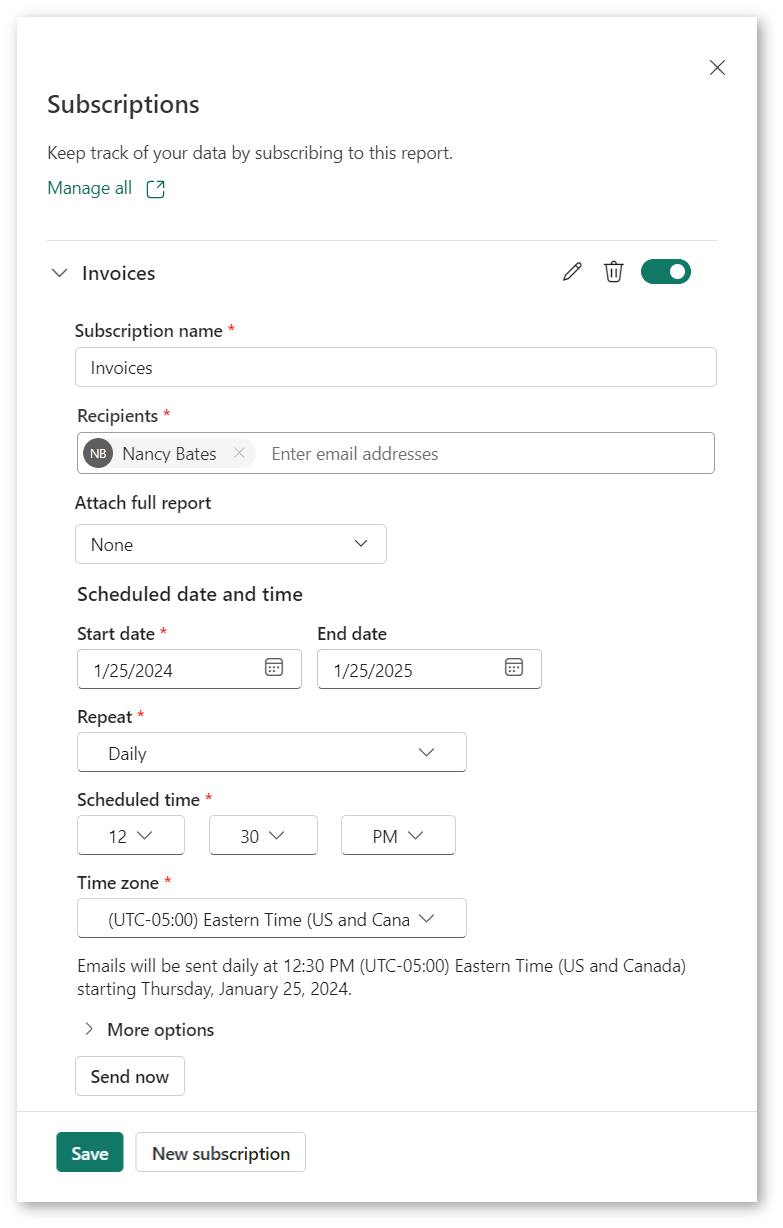
If you want to modify or cancel your subscriptions, you can do so via Settings (gear icon in the top-right corner of the screen) → Preferences → Notifications → Power BI Subscriptions.