
Quick Reference
- When Texada Analytics is first implemented for your organization, a number of initial reports will be made available to you via Microsoft Power BI.
- Each report consists of two parts: the report itself, and the semantic model, or the data on which the report is based. Semantic models cannot be modified, but they can be used to generate new reports as desired.
- To view the reports and semantic models for your organization, log in to the Power BI Service at app.powerbi.com, then click on “Workspaces” in the left navigation menu. Click on the workspace with your company name to view the pre-built reports provided by Texada Software.
- To open a report, click on it in your organization’s workspace, then click “Open report” in the Report details panel on the right side of the screen.
- When viewing a report, use the Pages panel on the left side of the screen to navigate the report’s various pages. Each page displays different information. Most reports also feature a control panel on the left side which allows you to tweak the report’s parameters. Finally, many of the elements in the report body itself can be interacted with by hovering or clicking with your mouse.
Introduction
When Texada Analytics is first implemented for your organization, a number of initial reports will be made available to you via Microsoft Power BI. The following article will detail how to access and modify these reports.
Accessing Reports
To access your out-of-the-box reports, log in to the Power BI Service at app.powerbi.com, then click on “Workspaces” in the left navigation menu. You should have access to a workspace with your company name. Click on it to view the pre-built reports provided by Texada Software.
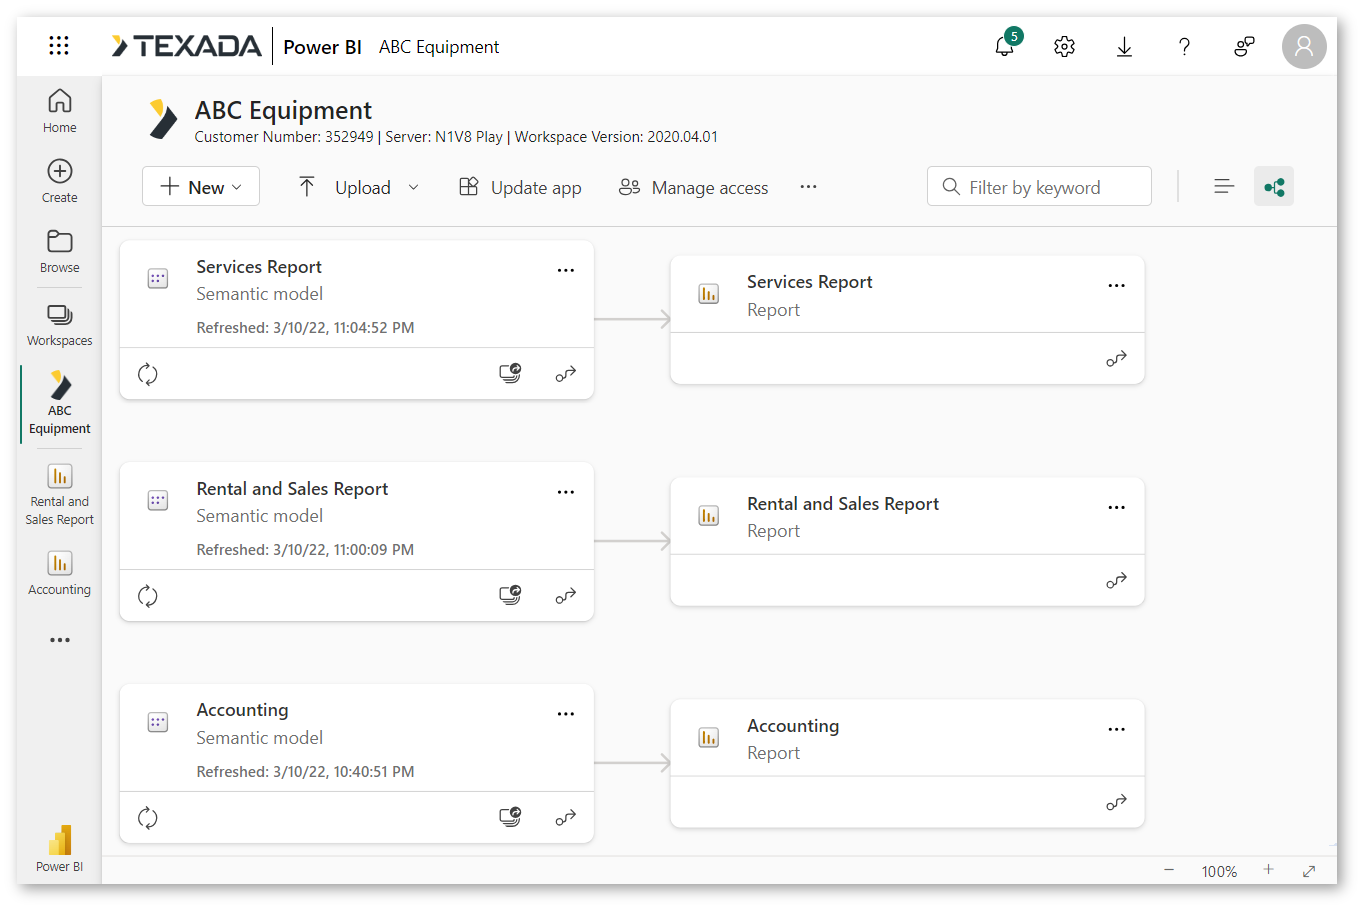
Each report consists of two components: the report itself, which can be modified in a number of ways to provide different visualizations, and the semantic model, or the data on which the report is based. Semantic models are provided by Texada and cannot be modified. In the screenshot above, you can see how each report is dependent on its semantic model.
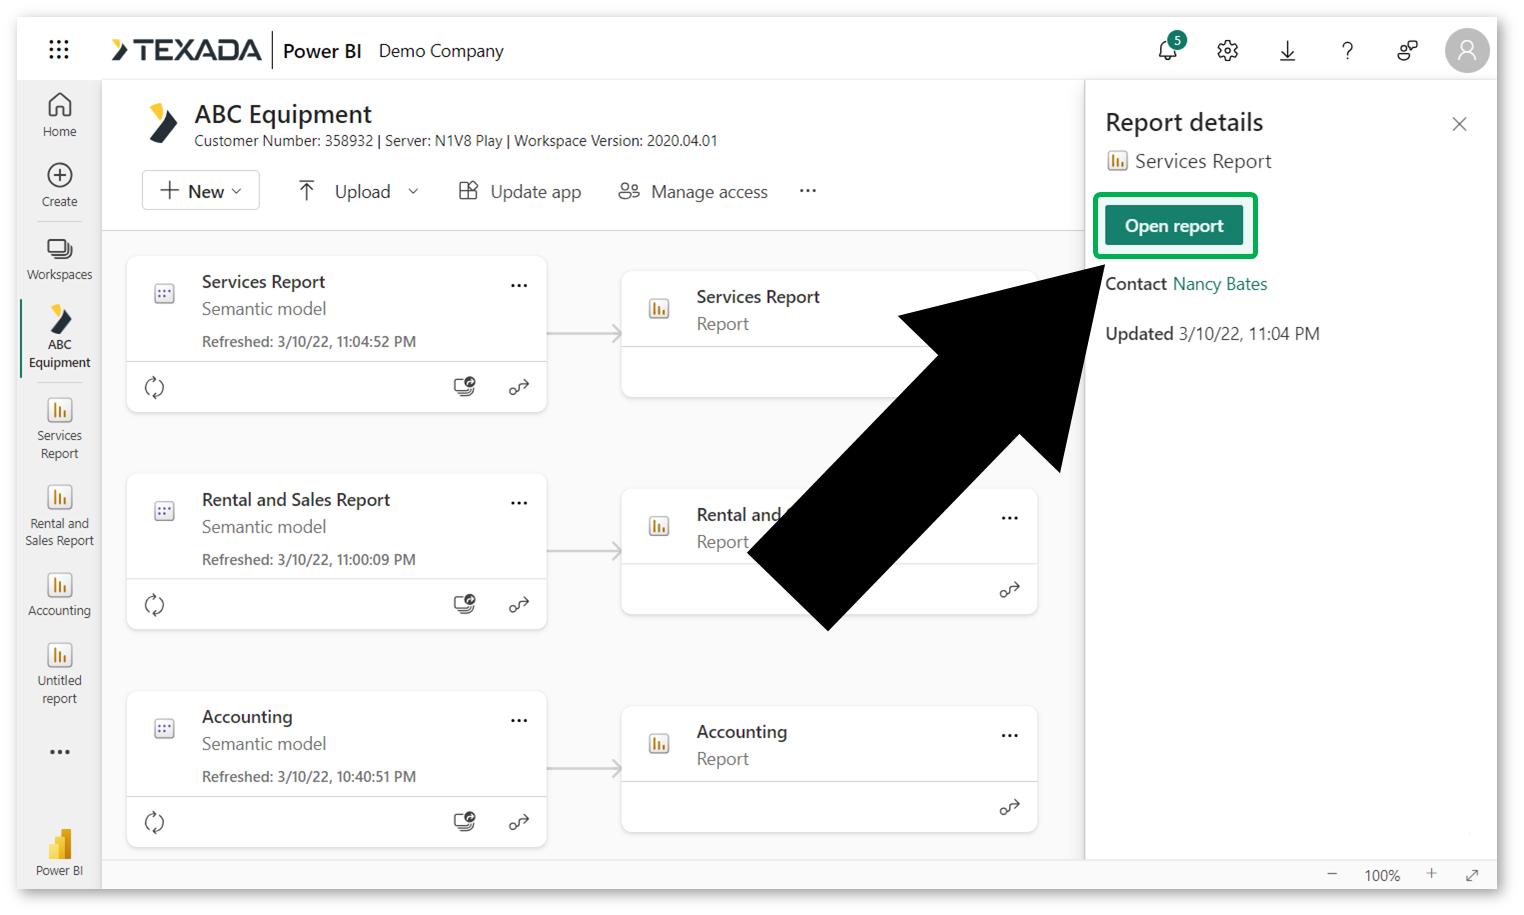
To open a report, click on it in the workspace to open the Report details panel, then select “Open report”.
Navigating a Report
When viewing a report, the screen is divided into three main sections: the Pages panel, the report controls, and the report itself.
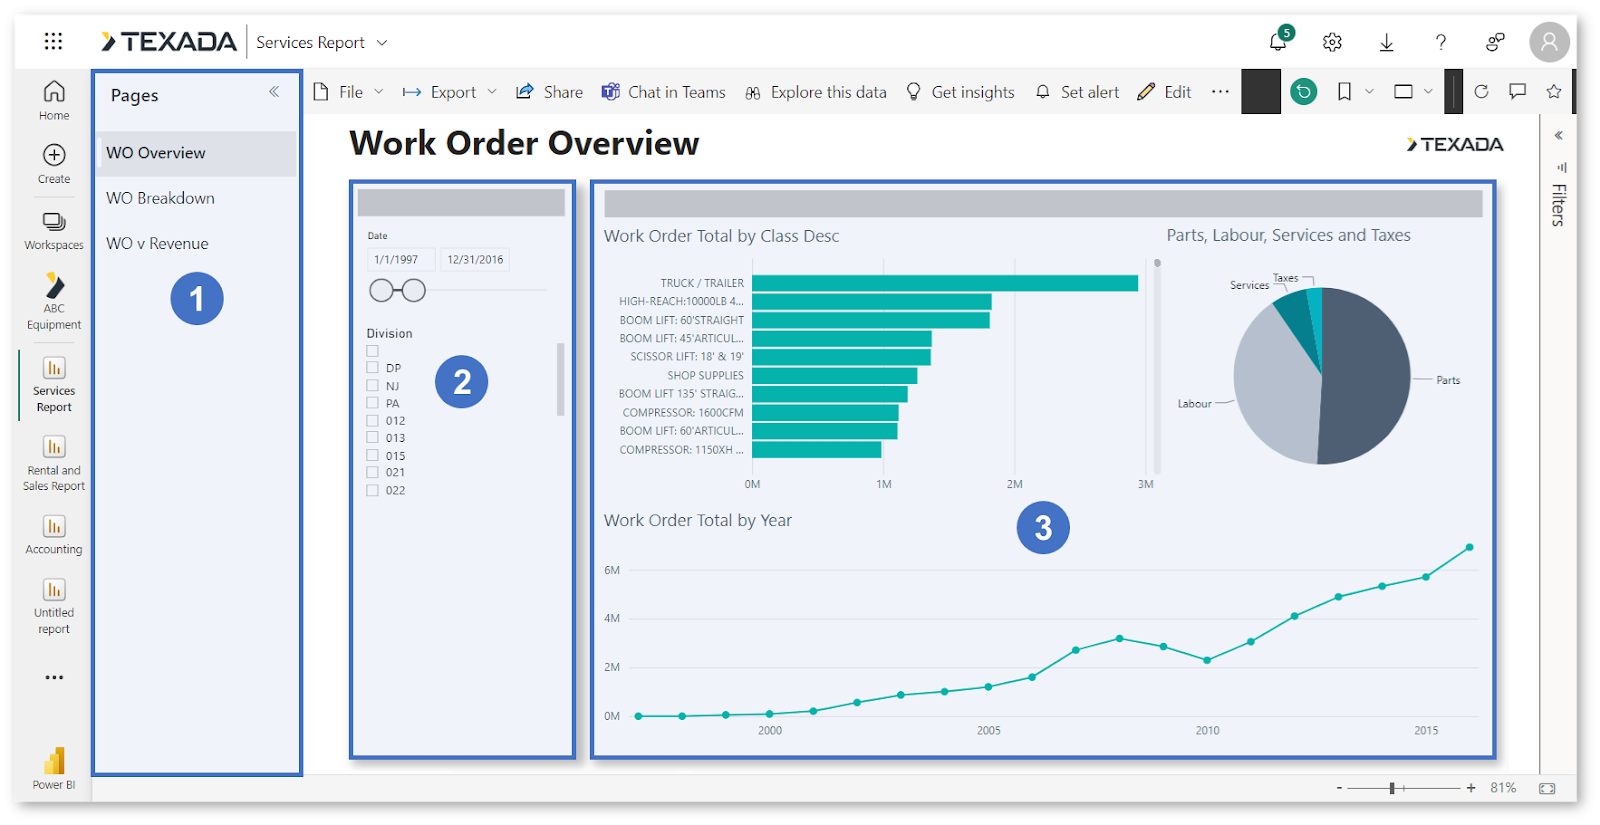
- Pages
Each out-of-the-box report consists of multiple pages. Different information is displayed on each. Click on a page to switch to it. Click on the backwards arrowsin the top-left corner of the Pages panel to collapse it.
- Report Controls
Most out-of-the-box reports feature a control panel on the left side that can be used to modify the report’s parameters. Different options are available for each report. Whenever you change one of the report’s parameters, the report will automatically refresh to reflect your changes. - Report
The main report is displayed here. Depending on the report, some of the elements in the report body may be interactable. Try hovering your mouse over an element to view more information, or clicking on an element to focus on it.
Reports
The out-of-the-box reports available to each organization are dependent on your organization’s region. For more information, see: