Introduction
When a new user first logs into Handle, they often wonder how to get started. It can help to understand the basic building blocks within the system:
- Tabs (aka Searches)
- Tiles
- Dashboards
In this guide, you’ll learn how each of these building blocks works together to create the efficient workflow available in Handle.
A Note to Administrators
At its core, Handle is an integration platform that brings data together, and all of that information is available to be configured. Once Handle is set up for your organization, users can quickly navigate the system and use the tools available to perform their assigned tasks.
The tools within Handle help you achieve the 4 ‘A’s:
- Access: Quick easy access to the information you need to do your job.
- Awareness: Visibility to things you may not typically be aware of.
- Action: Clarity on what needs action next.
- Accountability: Metrics and thresholds designed to change behavior.
We do that by creating a flow of information, from tabs (searches) to tiles and then to the dashboard.
The benefit of organizing data in this way is that you get user views that are shared and standardized. This makes it easy to train users on the items they need to be using. It also allows managers to view and monitor the data they need to track to keep their teams on track.
The Tab → Tile → Dashboard Flow
Understanding the flow of information in Handle is key to understanding its layout and navigation. That flow is designed to move from tabs (or searches), to tiles, and then to dashboards:
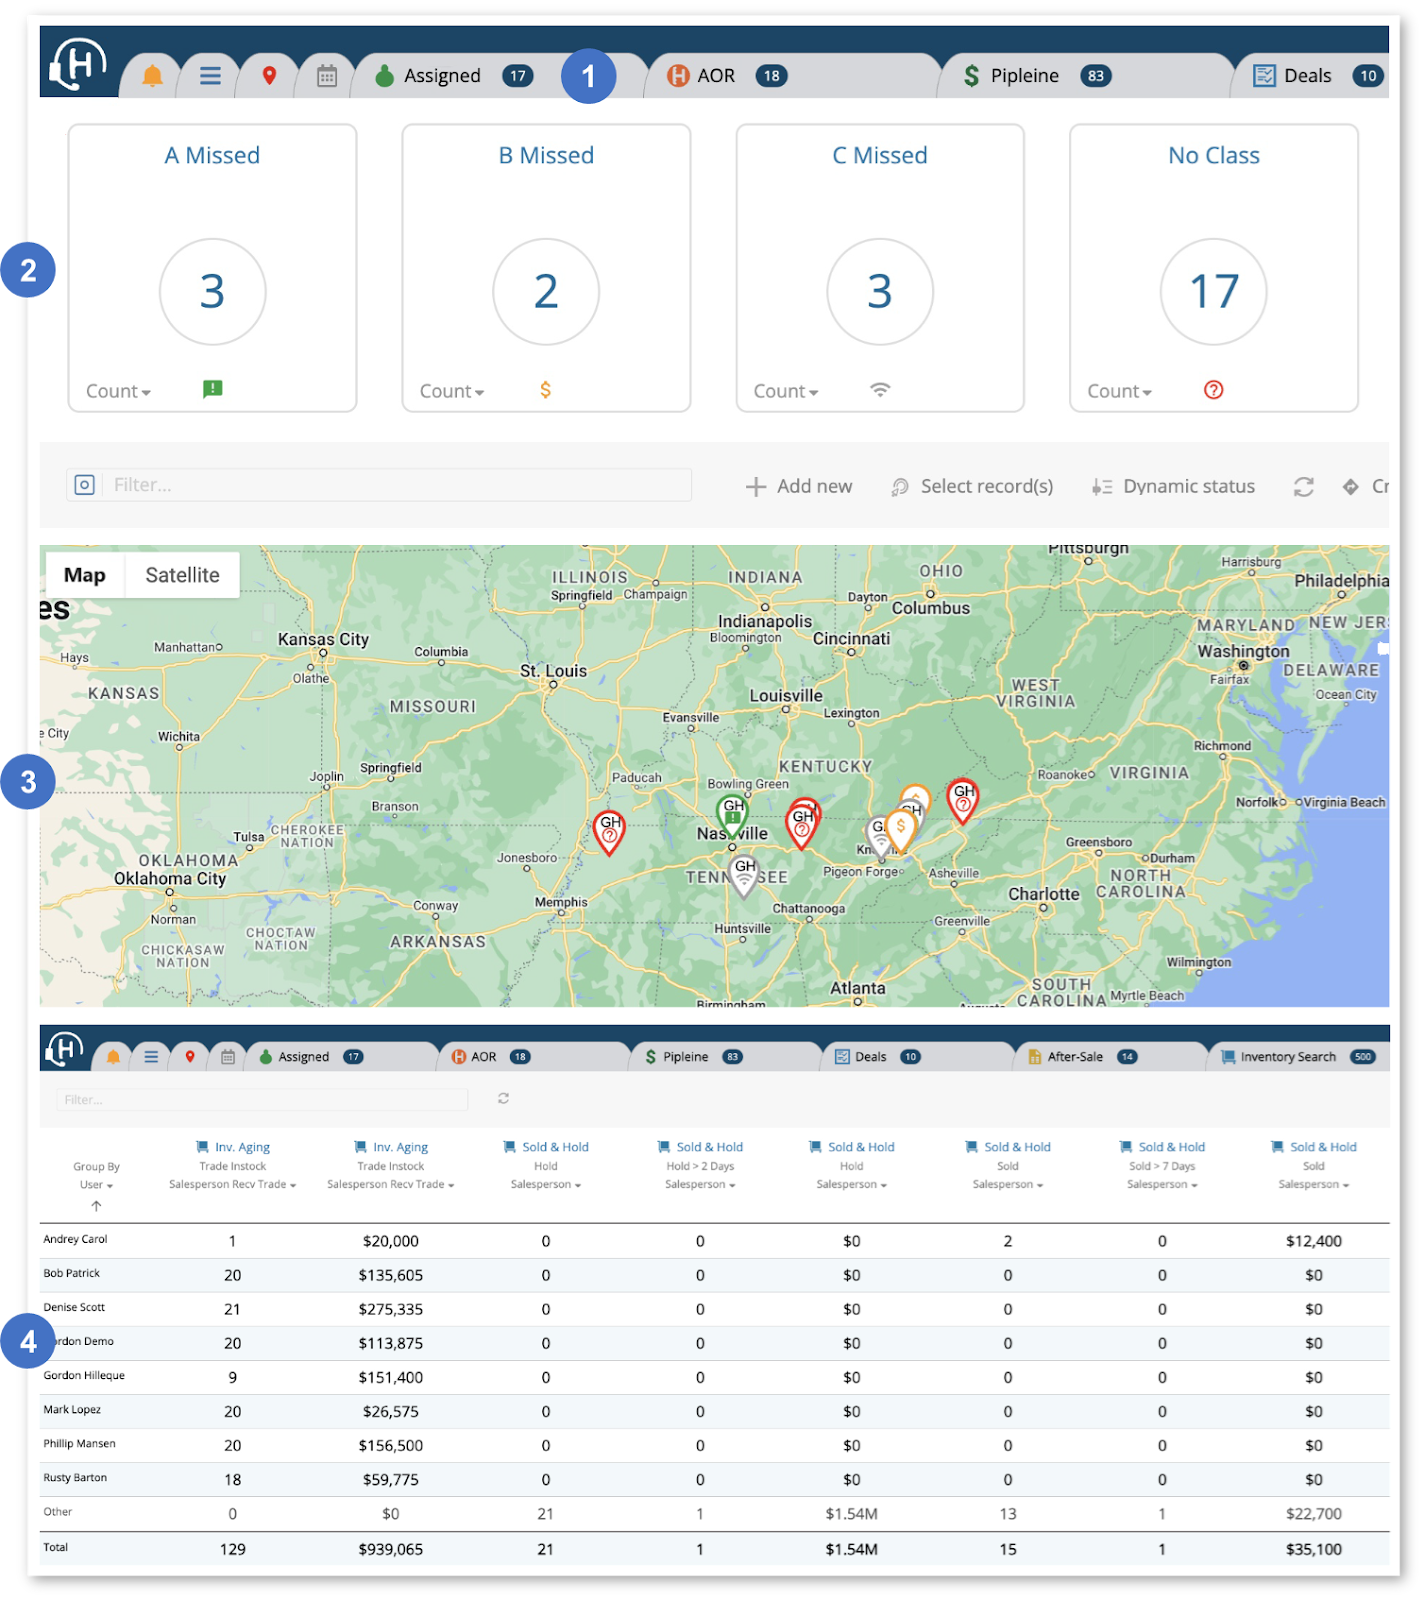
- Tabs
Tabs are used to standardize and streamline how information is viewed and rolled out to team members and management. - Tiles
Tiles highlight tasks or other items you need to focus on. - Mapping Data
- Dashboards
Dashboards create higher-level leadership or management views.
Understanding General Navigation and Layout
If you see a blank screen when you first log into Handle, don’t panic. It simply means you haven’t had your setup configured to the predefined views for your dealership.
The setup process includes configuring the tabs for your dealership and sharing them with the rest of your organization. Once that’s set up, it’s just a matter of learning to navigate within the layout.
Handle pulls data in the background from all the systems related to your dealership. All of this data can be customized for everyone depending on the views that person needs to access, from admins to general users. This creates a logical flow that includes tabs (which are essentially searches), tiles, and dashboards.
Let’s look at how each of these elements work:
Tabs (or Searches)
Every tab has a purpose allowing management or leadership to be available even when they’re not present. All tabs contain a search that can be configured to pull the data a team member needs. That could include account lists, inventory lists, quote lists, etc.
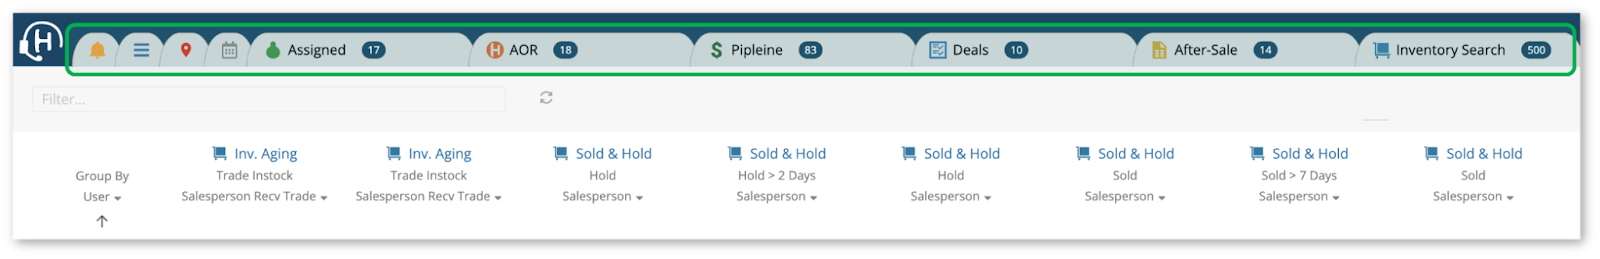
For example, one of your tabs may be configured for your Account List. Clicking on this tab will allow you to view all the accounts you’re assigned to deal with.
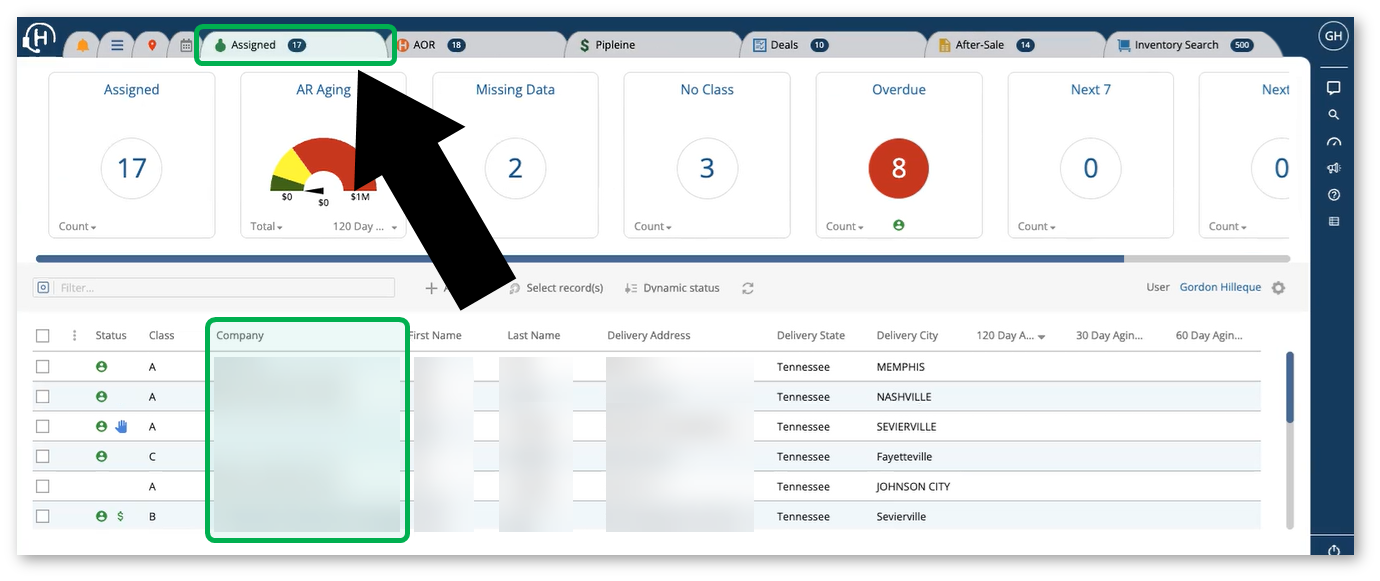
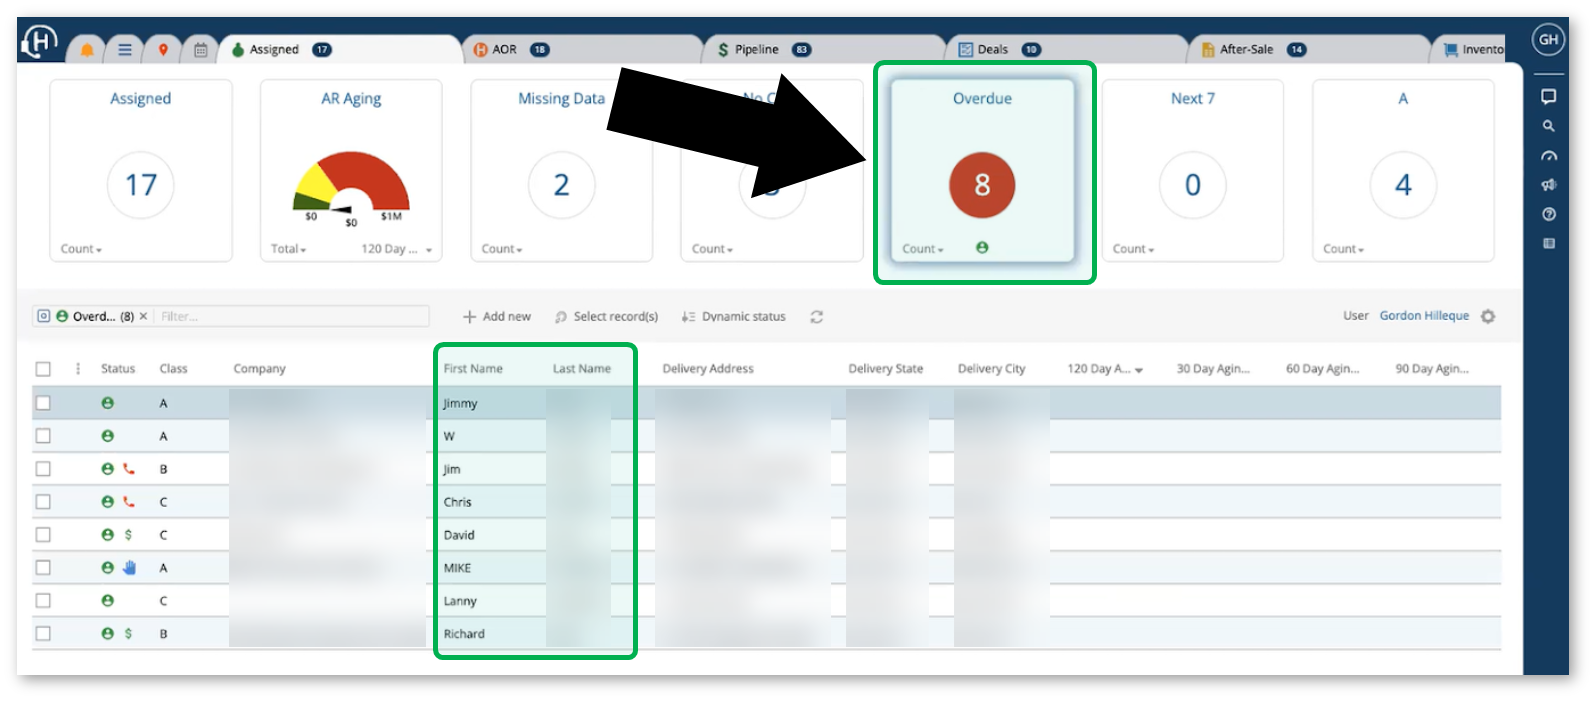
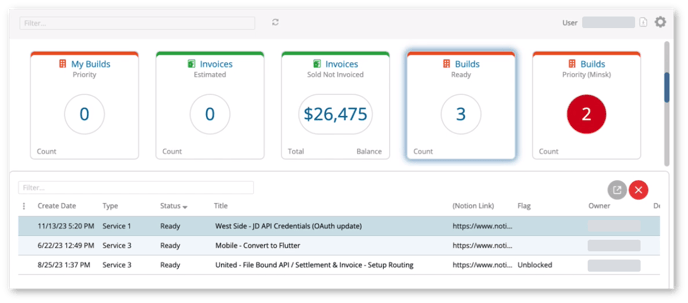
Tiles
Once inside any tab, you will see a series of tiles that highlight the tasks you need to focus on.
Tiles are designed to organize the data within a tab into subsets, points, or tasks related to the information in that tab.
For example, the accounts tab may include a tile that highlights accounts that are overdue for follow-up calls.
Understanding how tabs and tiles work together is key to understanding the basics of Handle. Tabs pull all the data needed for a view, and Tiles draw attention to specific activities or information related to that view.
Dashboards
The next step in the Handle’s workflow is Dashboards. Dashboards are generated from the tiles and can be used to create higher-level leadership or management views that can be broken down by users and/or locations to analyze the data.
How to Apply This Flow
Dashboards compile data from multiple searches/tabs into one view. The way they do that is through tiles.
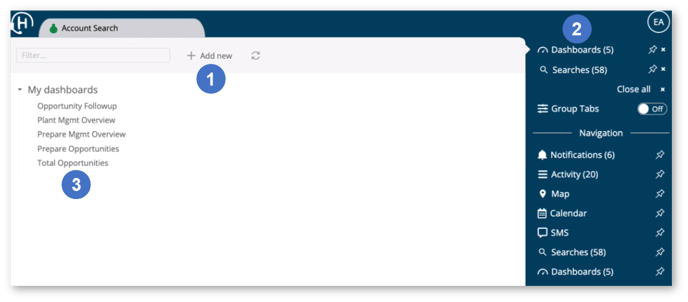
- Add New Button
Click here to create a new dashboard. - Dashboards
Click here to view your dashboards. - My Dashboards
Your dashboards are listed here.
Tiles give you a filtered view of the data they report.
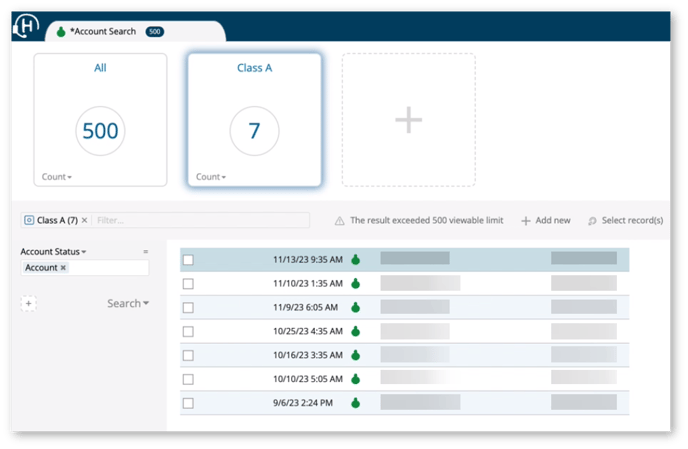
For instance, you can have a tile that’s titled “All,” which gives you the total number of prospects, calls, or any other piece of data. You can then create related tiles that filter that data in different ways. For instance, one may tell you the number of Class A prospects.
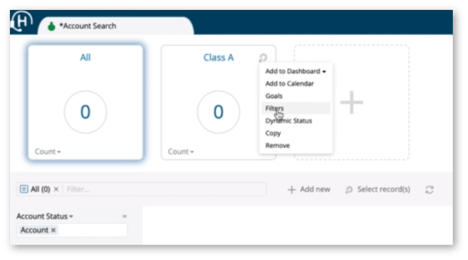
Perform a Search and Create a New Tile: Account Search
- Click the + (plus) to create a new tile.
- Name the tile.
- Click the upper right corner and select “Filter.”
- In the lower left corner, select “Add Filter.”
- Select the appropriate filter for this tile.
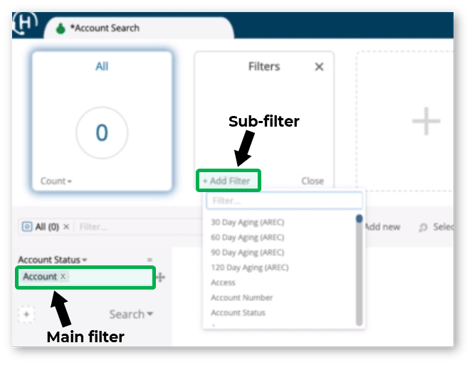
- Click “Search.”
This creates a tab with a specific search on it. The search (main filter) is only pulling in records that are classified as accounts. The tile will further filter the accounts, so you have a count of all the accounts that are classified as (or have a Class) A.
As you can see, tiles run a subfilter to any search. And when you add goals, they will alert you to their status.
Add Goals to a Tile
- Click the upper right corner and choose “Goals.”
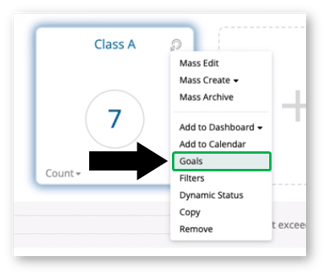
- Add a goal.
- Set the color.
- Set the range for that goal.
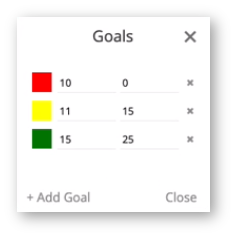
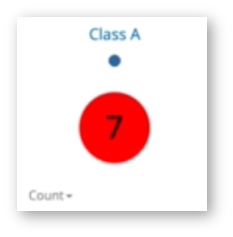
These numbers indicate when that color should appear — when the goal is being met, is approaching the limit, or needs work. For example, this tile shows 7, which is in the red zone, according to the goals we set for this tile.
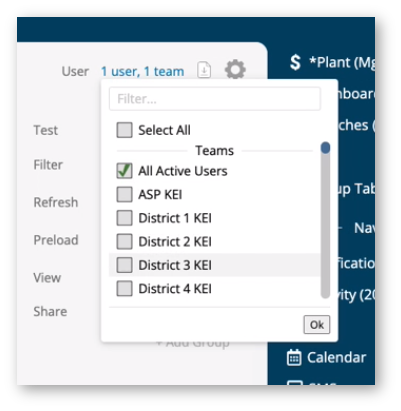
Create a New Dashboard for This Tile
- Click “Dashboards” in the right navigation bar.
- Click + to create a new tile.
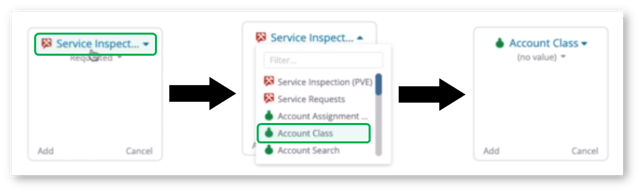
- Click on the name of the tile and select “Account Class” from the dropdown. (This is the type of search/tile we created above. If you performed a different type of search, you’ll need to select a different item from the dropdown.)
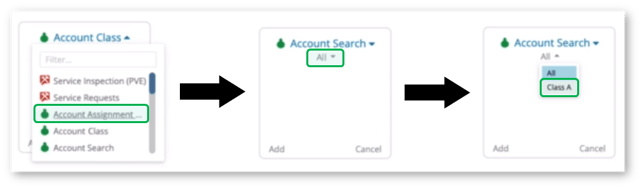
- Select “Account Search.”
- Click on “All” to open the dropdown and choose “Class A,” the tile we created above.
- Click “Add” in the lower left corner of the tile.
- Give the dashboard a name and click Save.
Create Tiles to Audit Quotes You’re Running
In this same view (tab), you can add more tiles that audit your quotes. Here’s how:
- Click + (plus) to create 4 new tiles.
- Handle User Guide Updated 11/2023 Page 10 2. These will audit quotes that you’re running, service requests, service scheduled, and uptime.
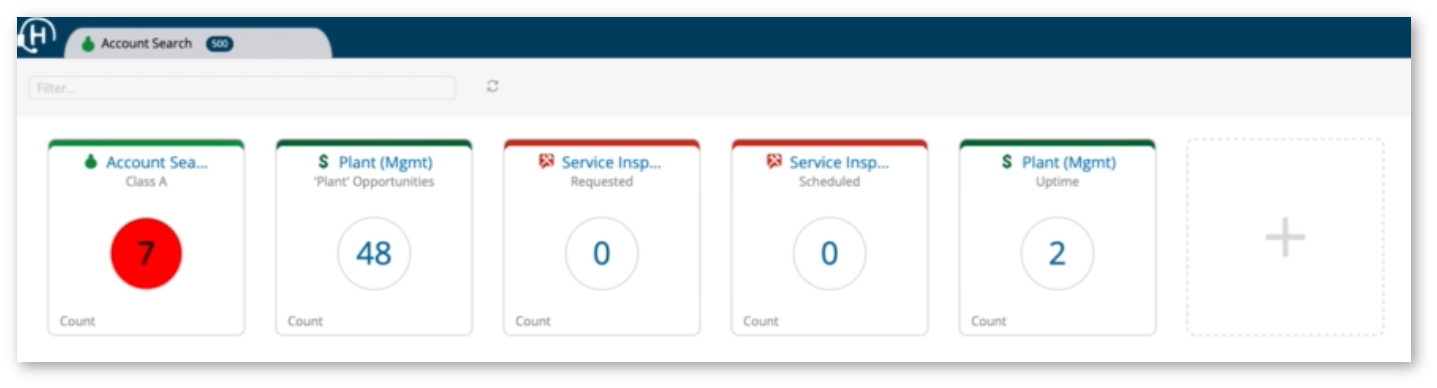
This allows you to pull multiple searches across multiple record types into one view and easily see them broken down for you.
Create a Master Dashboard
If you want a master dashboard for key subsets of data you want to see on a regular basis. For instance, if you were to click on the fourth tile above, you can see the results of that tile.
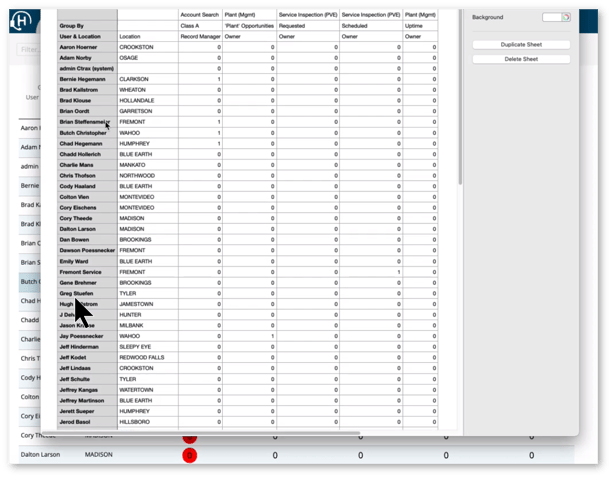
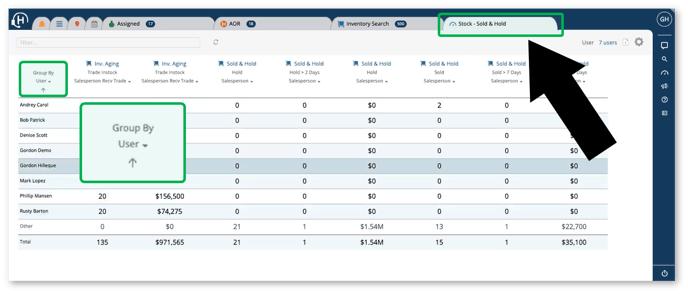
Group Grid
For managers, the group grid gives you another level of oversight for users and user locations.
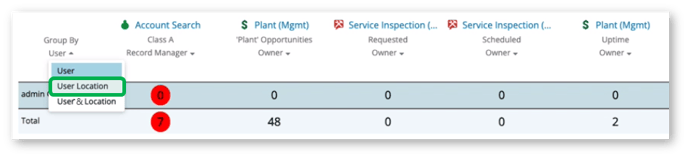
You can then pull in that data. On the right, select that data you want to view.
This pulls in that data and allows you to see at a high-level glance specific data for each rep.
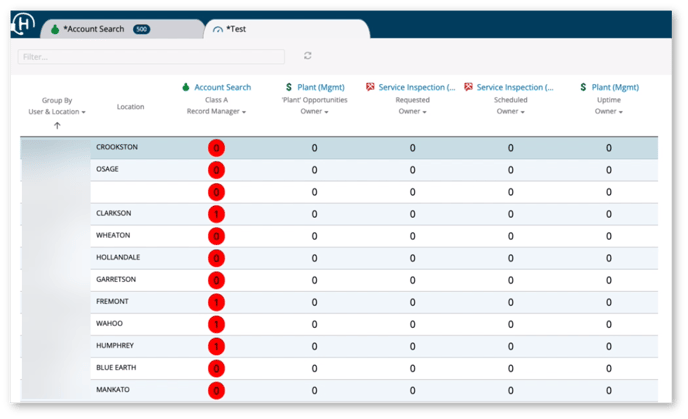
This can then be exported as a CSV file and filter the data as needed.