
Create a New Tile
The number in the middle of the tile represents all of the items in your saved search. But tiles allow you to further filter that data.
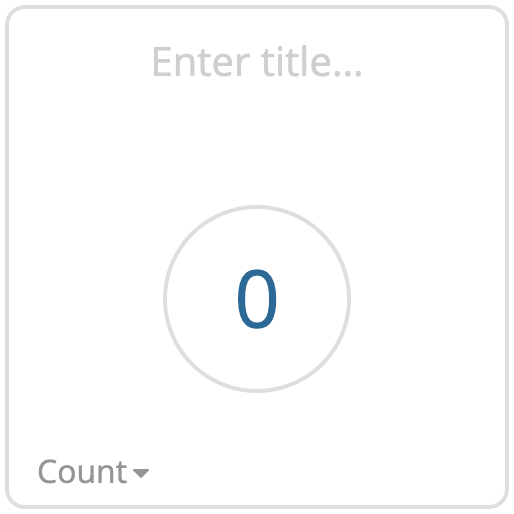
To create a new tile:
- Click the + in the middle of the next available tile.
- Name the tile with a descriptive title.
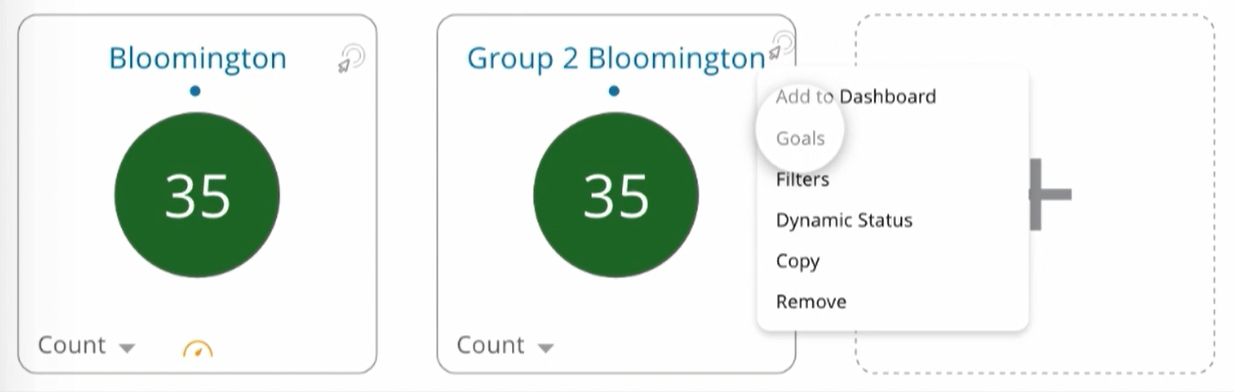
- Set the tile options with the tile options menu, which you can open by clicking on the icon in the top right corner of the tile.
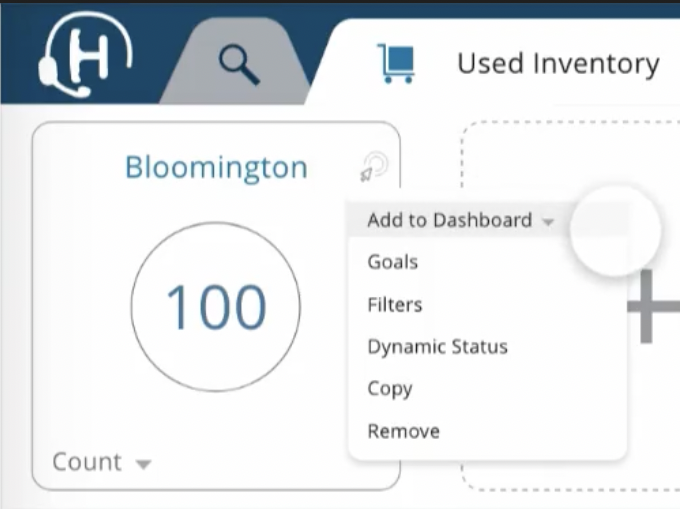
Here’s what each of those options does:
- Add to Dashboard: Allows you to add the Tile to a dashboard.
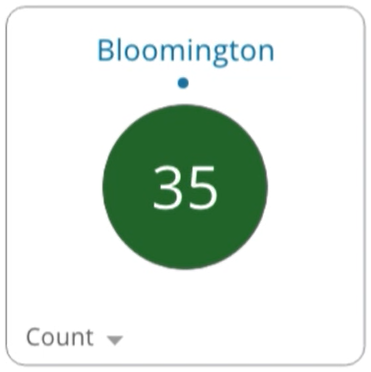
- Goals: Allows you to set a color for the tile, based on targets/limits you configure.
For example, you may use the colors green, yellow, and red to indicate that numbers are where they should be, are getting low, or are too low.
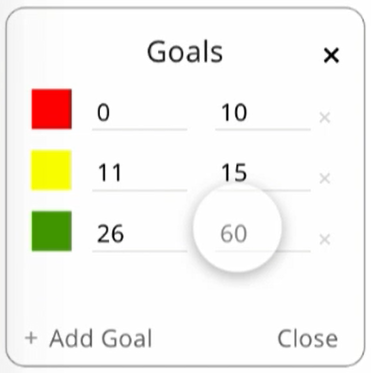
To configure goals:
- Select any color for the goal.
- Enter the numerical target/limit for this goal.
When you add another goal to a tile, the beginning value defaults to the same number as the upper limit of the previous goal. For the colors to display correctly, you must change the initial value of each goal to be at least 0.1 higher than the previous value.
There are two ways to see goals: the tile view (standard) or the gauge view.
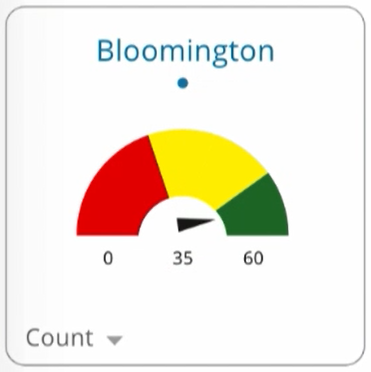
To change the view:
- Click the dot above the number or gauge.
- Select the view you prefer from the dropdown.
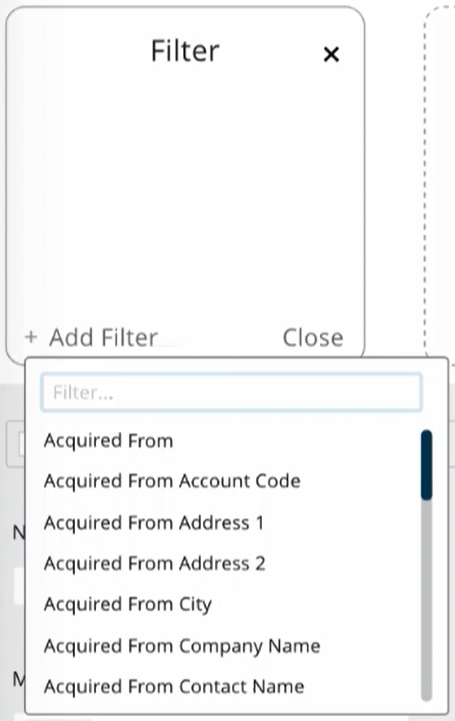
Filters
Filters allow you to further refine your search. You can add as many filters to a tile as you want.
- Click + Add Filter.
- Select filter options from the dropdown menu.
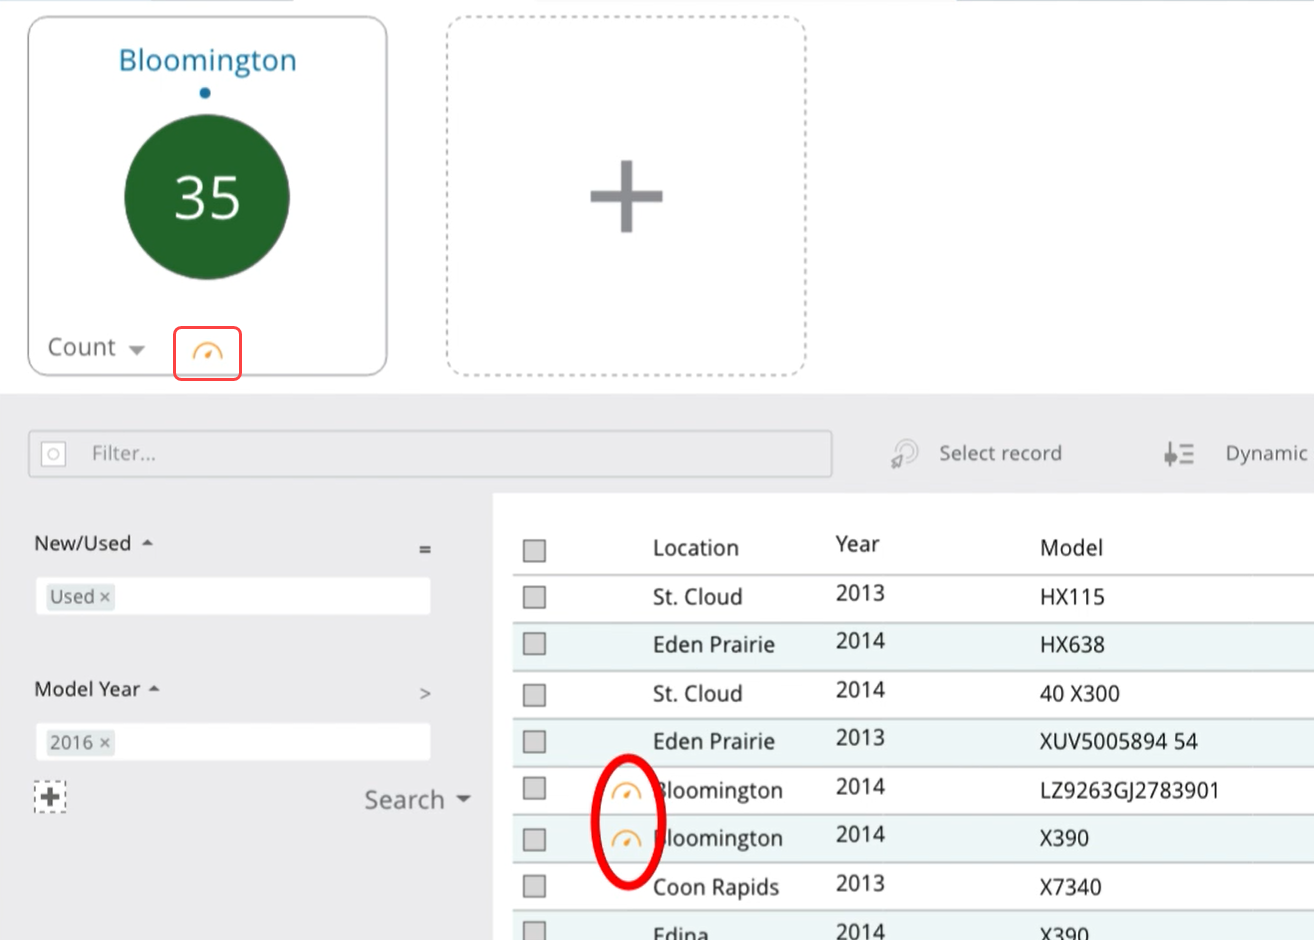
Dynamic Status
Helps you organize and visualize what is going on in your saved search. The dynamic status icon is shown at the bottom of the tile and beside any item in the search that fits the criteria of that tile.
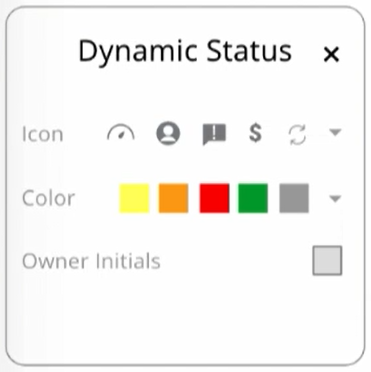
To configure Dynamic Status for a tile:
- Choose an icon. (Click the carat for a dropdown with more icon options.)
- Select a color for the icon. (Click the carat for more color options.)
- Check the box if you want owner initials to be displayed.
Once Saved, all items shown in the Grid that fit that tiles criteria will have a dynamic status icon next to them.
For more In-depth Info, check out “Dynamic Status Indicators” (article forthcoming).
Copy
If you’ve set up an advanced tile and want another tile with similar data, you can copy the existing tile and adjust its configuration rather than creating a new tile from scratch.
- Copy the original tile.
- Rename the tile.
- Tweak goals and filters, if needed.
- Re-configure dynamic statuses. (These are not copied.)
Configure Count on a Tile
To configure a tile’s count, click “Count” in the bottom left corner of the tile.
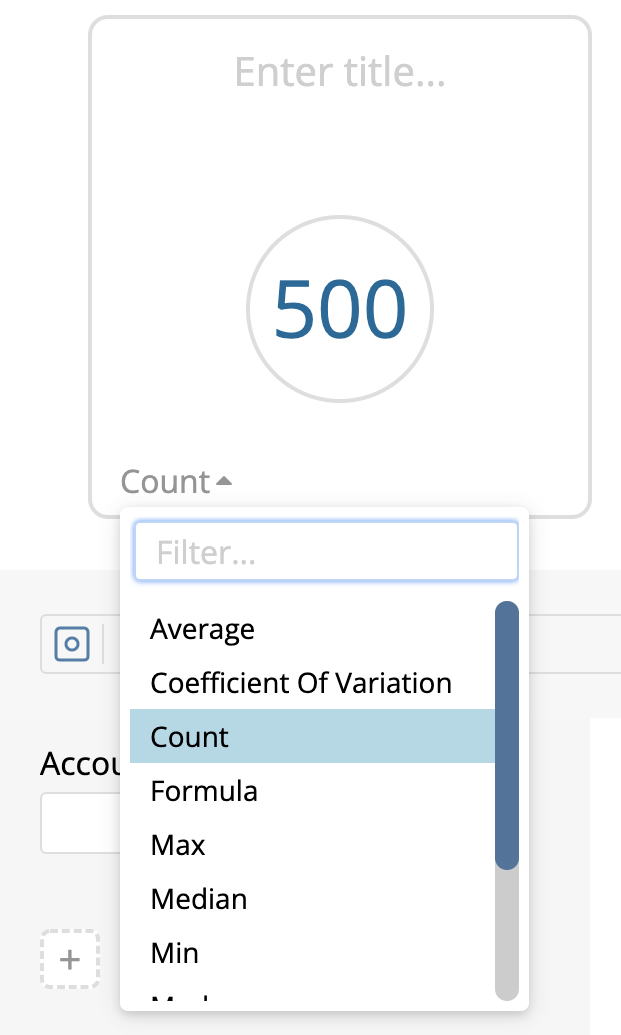
Here, you can configure the tile to perform advanced calculations, including:
- Average
- Coefficient of Variation
- Count: Most common
- Formula
- Max
- Median
- Min
- Mode
- Standard Deviation
- Total
- Variance
Dashboards: Grid Setup
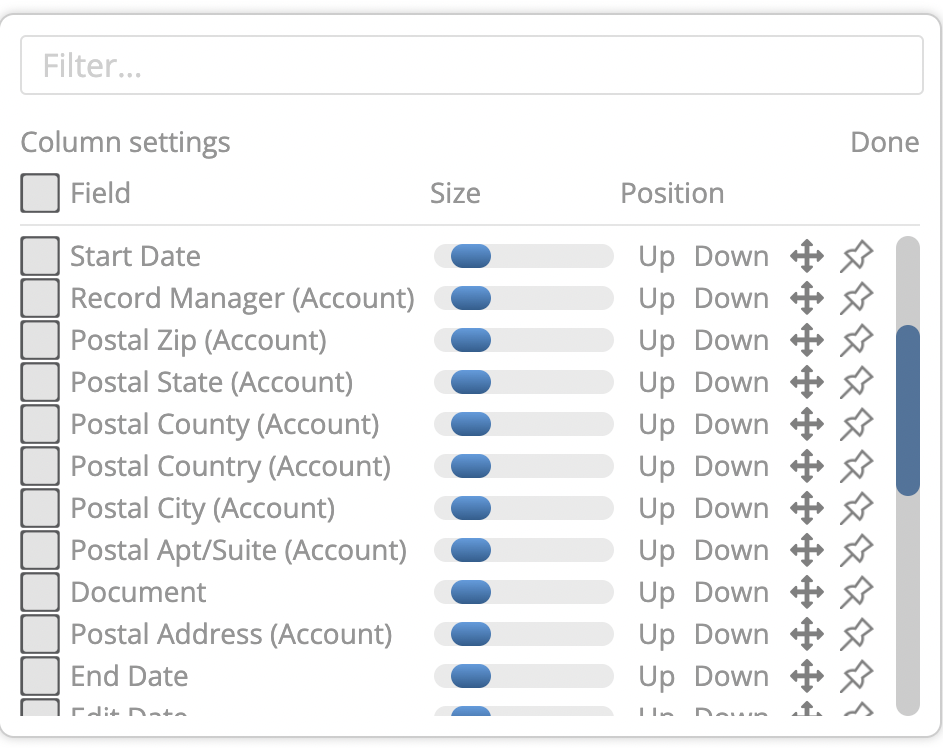
- Hover your mouse in the space next to the column name.
- Click the Column Settings (Gear icon).
- Select the columns you want displayed in the Search. Options include:
- Field
- Size
- Position
- Grab (Arrow icon)
- Pin (Pin icon)