
Everyone wants a dashboard—having all the numbers that guide your business all in one place just makes sense. But creating and managing a dashboard is often can be more trouble than it’s worth.
Handle’s Dashboards are simple to make. With just a few clicks any Tile from across all of your Handle Searches can be added to any Dashboard you’ve created. And sharing across your team is easy, with changes you make to a Dashboard updating across users automatically.
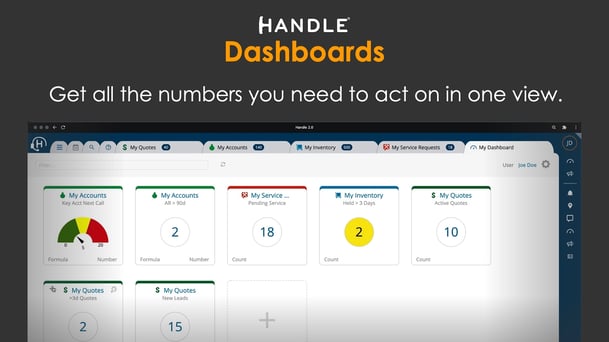
 Centralizing data to drive action:
Tiles pulled from Inventory, Account, Service and Pipeline data combined in a personalized dashboard of priority tasks. Each tile provides a single click to the list of items needing immediate attention.
The best-in-class teams are using Dashboards across their organization to:
- Provide their staff an easy way to stay on top of tasks and assignments
- Help managers track performance, find issues, and ensure coverage across their teams (made even more effective with Handle’s Grouped Grid dashboard views)
- Give leadership insight into the health of the business, progress toward goals, and indications of when to shift strategy
How To Heading
What You’ll Need
- Some Searches in Handle with Tiles that represent the information that you want to monitor or draw attention to
1. Plan your Dashboard
A Dashboard exists so someone can act on the information it contains. So before making a new Dashboard, start by identifying who it is for, what you need them to do, and what flags or metrics will drive their actions — those flags and metrics will determine what gets added to the Dashboard.
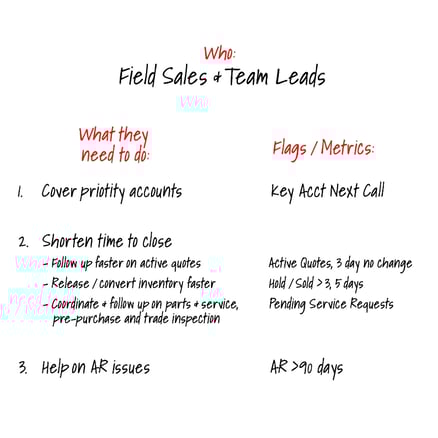
Each Dashboard Tile gives you one click access to the records behind the Tile, making them not just informative, but also ways to drive action. If you have a KPI YTD Sales in your Dashboard, add a related, actionable item like Active Quotes or New Leads.
2. Make a new Dashboard
- Click on the Dashboards view icon
 to access your list of existing Dashboards (if you don’t have any, the list will be empty).
 - Click on the + Add New link

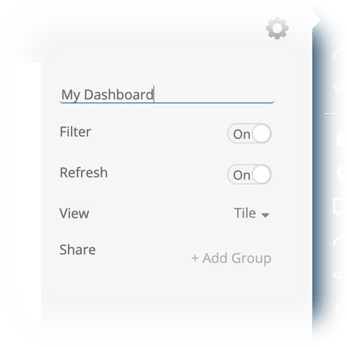
- Click on the Settings Gear icon
 to open Settings Panel so you can give your Dashboard a name and then click on Save at the bottom of the panel
3. Add Tiles
You can add Tiles from inside your new Dashboard, or send a Tile into a Dashboard from any Search view.
From inside the Dashboard
- Click on the empty Tile with the large plus sign
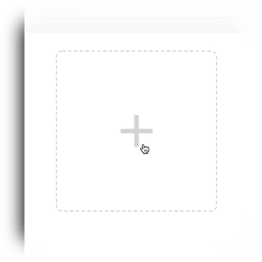
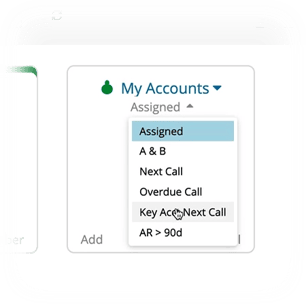
- From the dropdown list of available Searches, select the Search that contains the Tile that want added to the Dashboard
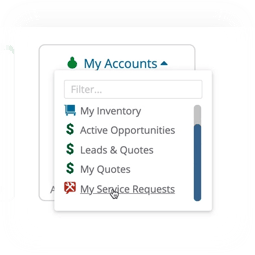
- Select the desired Tile from the dropdown list, then click Add to confirm
From inside a Search
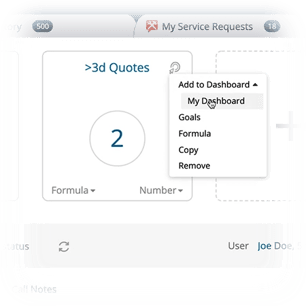
- Mouseover the upper right corner of the desired Tile and click on the Actions icon
 that appears
 - Click on Add to Dashboard
- Then click on the name of your Dashboard to automatically add the Tile
4. Set up Sharing
- Click on the Settings Gear icon
 to open Settings Panel
 - You can use the dropdown menus to select the users that you wish to share the Dashboard with, and set access permissions (Can View or Can Edit)

Tiles pulled from Searches that use Dynamic Users allow you to setup one master Dashboard that can be used as a personal tracker for every member of your team.
With Handle’s Teams, you can set up a team so that the same Dashboard you created for your team members can aggregate the totals for the team. Then quickly switch to Grouped Grid view to see the individual performance of your entire in one view.