
Companies want to be able to easily track sales goals, and they need to be able to set goals for individuals, groups, location, or category of sales.
To help, we’ve developed an automated tool that is completely configurable for your needs. It provides dashboards that measure the specific goals you want and quickly and easily reports on them. This module lets you:
- See your sales targets versus actual activity (updated daily)
- Automatically track units, volume, surplus deficit, cost, and margin dollars
- View by individual, team, location, or category of sales
Setting Up Goal Tracking: 3 Steps
- Configure what you want to measure
- Fill in the sales goal target
- Configure your dashboards
Step 1: Configure What You Want to Measure
The first thing you need to decide is what you want to measure and how you want to measure it.
For example, you might want to track Volume $ of sales in a certain category of equipment by salesperson as well as location to compare it against your corporate or market share annual goals.
You can track unit, volume, cost, and margin sales. Common filters used in our configurable search tool are:
- Inventory statuses: You can measure anything, e.g., only invoiced equipment, what’s been sold, or what’s not been sold
- Equipment Categories: Set specific measurements per one or multiple categories of equipment using any data you have
- Time frames: You can track things on an annual, quarterly, or weekly basis, or set up specific date ranges
- Team members: You can set behavioral and sales goals for individual salespeople
For instance, most organizations want to place goals around units, volume, margin, or cost on specific types of equipment and set goals for a specific time frame.
If you know these numbers and measurements, we can easily start the configuration process. The Goal Configurator is the advanced search you use today.
You simply start a new search using the Goal Configurator and Handle will automatically create records and calculate the totals you need.
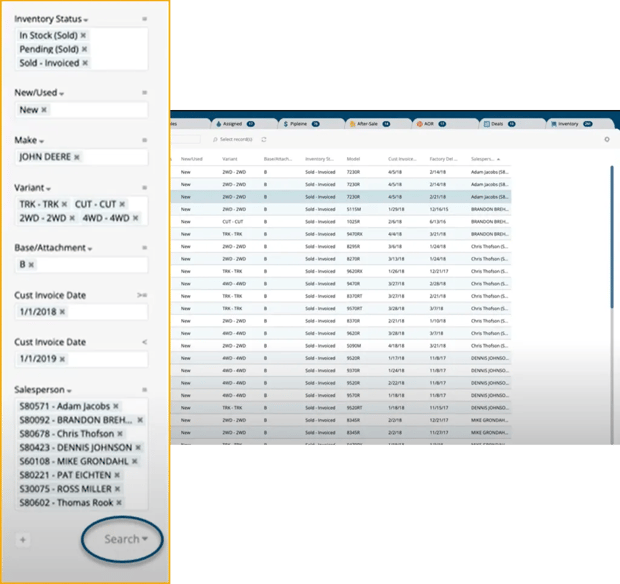
In the Goal Configurator, you’ll set up your search criteria in the left sidebar. You can select inventory statuses, makes, variants, date ranges, and salespeople you want to track. Then save it with a unique name.
This can be updated at any time, and based on the search criteria, your records to measure your sales metrics will be created automatically.
You can create multiple measurements by creating multiple searches. If you have another measurement that you want to make, you only need to set up another search with those parameters to generate the additional records.
**The key to this step is saving the search with a unique name, ideally involving the date. This is critical as the records we automatically create will be named this and be used in the reporting. For example, if you are measuring Tractor Sales for 2023, you could call the search 2023 Tractors.
Step 2: Fill in the Sales Goal Target for each Target or Salesperson
Once you’ve configured your sales goal searches, our system automatically creates records per salesperson (if selected) on a nightly basis. If you did not select specific sales people, Handle will create If you did not select specific sales people, Handle will create a single record totaling all items that match the search criteria.
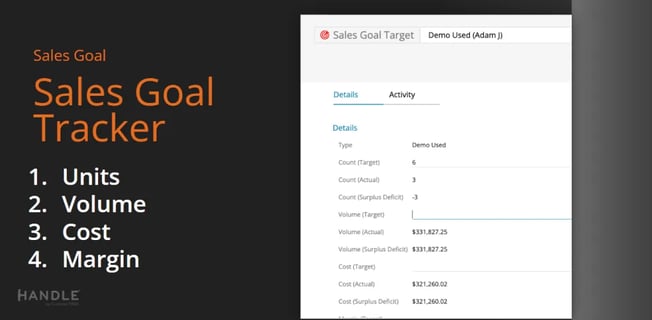
Here’s an example of an automated record that’s been created for a particular salesperson using our prior example.
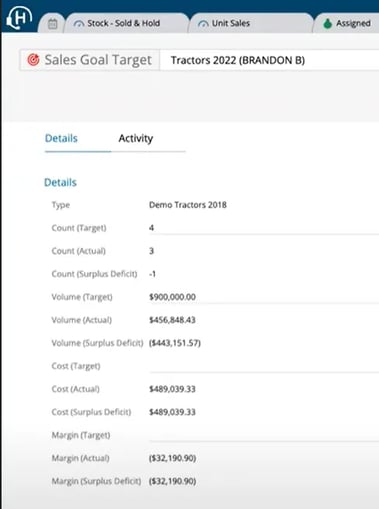
As you can see, it’s titled based on the search parameter (or configuration) that we created in step one. In this case, it’s Tractors 2022.
So we took all the tractors, either by model or category, and totaled those up. And you can see the numbers that it’s calculating. It’s telling us:
- What the actual number of sales are
- What the volume is
- The cost
- The margin dollars
This is where you can input the Goal. The system then calculates either the surplus or deficit, which can easily be used in reporting across the entire organization, the store, or by individuals themselves.
Handle automatically calculates this data on a nightly basis. So you get a day-to-day or a near-real-time view of where the team is at their actual sales, number of units, or whatever variable you’re tracking, such as the cost, margin dollars.
Step 3: Dashboard Configuration
The final step is to configure your dashboard specifically for you. The dashboard can be used to tell you how close people are to reaching their goals. It can be totaled up by the entire organization, category of equipment, store location, or any other variable.
Configuring these requires an understanding of Handle Tiles and Dashboard but does not require any development.
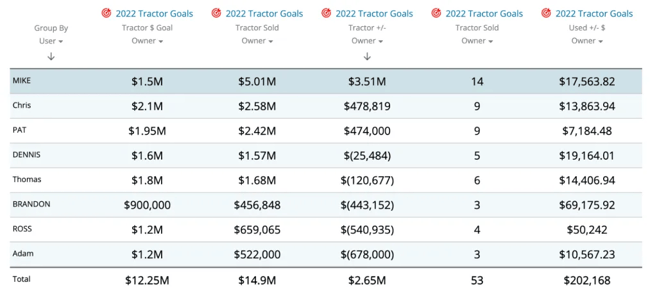
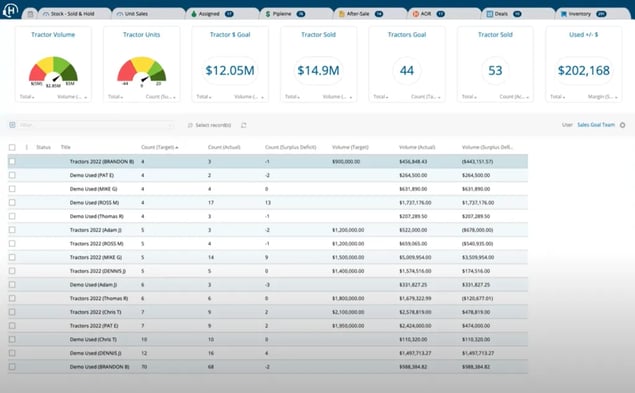
The tiles at the top of the dashboard show you the total units sold, what the goal was, what the difference is, and how far someone is from hitting the goal.
Your dashboard view is flexible and configurable, so you can view it any way you want. Once you’ve completed the first two steps of (1) configuring what you want to measure, then (2) entering your goals, the system runs automatically based on the different views and dashboards that have been set up for you.
Ready to get started? Contact Texada support. We’ll chat with you to understand what you want to measure and how you want to display your reports.