The CMA Dashboard
An overview of the Condition Monitoring Portal’s CMA Dashboard.
CMA Dashboard
The CMA Dashboard displays various views of data about alerts:
- Cases Summary
- Alerts by Data Source
- Alerts by Compartment
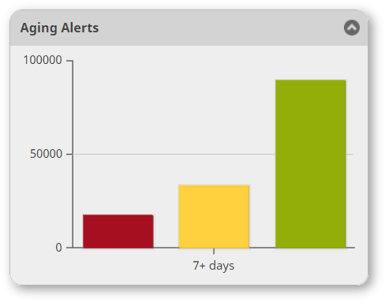
- Aging Alerts
Additionally, you see alerts displayed by equipment groups.
Cases Summary
The Cases Summary displays a list of CMAs and their corresponding Active, Pending, and Closed (30 days) cases. The Closed (30 days) cases have one column for “w/ Leads” and one for “No Leads.”
NOTE: SalesLink access is required to view leads.
The numbers in each column indicate the number of cases being worked on by the CMA. Click the number to navigate to a Case List page and view details about those cases.
Use the filters at the top of the page to filter the cases that display. Once you make your selections, click the Filter button .
The Case List displays information including the Case Number, Status, Open Date, Closed Date, equipment details, and customer information.
Click the Case # link to see all of the case details. From the Case Detail window, you can attach Alerts, Files, Related Data, and other Notes.
Click on a serial number to view detailed information on that equipment. See “EquipmentLink User Guide” for more information.
Alerts by Data Source
There are four sources of alerts in CM Portal:
- Scheduled Oil Sampling (SOS)
- Fault Codes (FC)
- Technical Analysis from inspections (TA)
- Service Letters (SL)
The Alerts by Data Source chart lets you see where the alerts in your equipment originated.
Alerts by Compartment
Alerts by Compartment displays the location of alerts in your equipment. Alerts that do not fall into a single compartment, or that may not have been mapped appropriately, have been assigned to Other.
Aging Alerts

Aging Alerts displays all alerts that have not been reviewed in at least seven days since they occurred.
Equipment Group Table
The table at the bottom of the dashboard displays alerts by equipment group.
Equipment is grouped according to the following:
- Known Equipment – Equipment with information in DBS
- Equipment in Machine Population
- Not Monitored
- Unknown Equipment – Equipment without information in DBS
- Equipment in Machine Population
- Not Monitored
- EMT – Equipment monitored under various agreements in the Equipment Monitoring Toolkit application.
- CSA Equipment
- Rental Fleet
- Custom Subscription
.png?width=365&height=50&name=Texada%20Logo%20(Black).png)