
Performance Profile
Click the Performance Profile link under PIPELINE in the top navigation bar. The Performance Profile page displays.
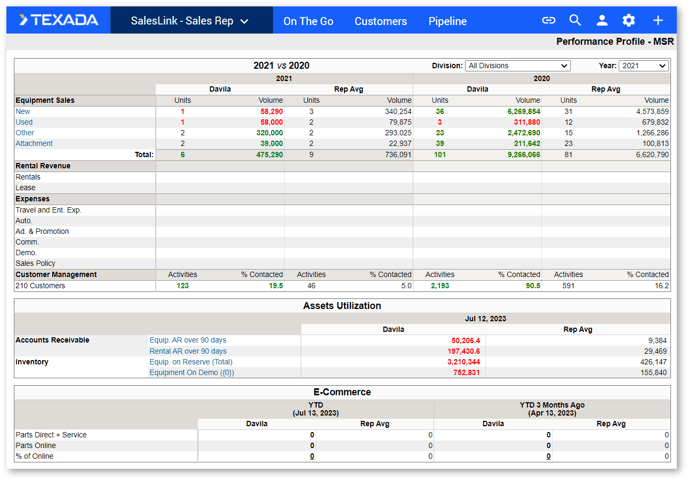
This page displays a detailed table of your sales information for the current and past year. The numbers appearing in green and red are being compared to the average of all of the other sales reps. Green represents above-average performance, red represents under-average performance. A number in Black means that it matches the average exactly.
Use the drop-down menus at the top of the page to change the Division and Year of information displayed in the table.
Export the table into an Excel spreadsheet by clicking the [Export] button at the top right of the page.
Add Lost Sales
To add a lost sale:
- Click the Plus icon at the far right of the top navigation bar.
- Select [Add Lost Sales] from the drop-down menu.
- Click the magnifying glass icon and search for a customer.
- Select a division for the customer.
- Enter all required information into the Lost Sales form.
- Click the [Save] button to enter the lost sale.
My Lost Sales (All Customers)
Click the My Lost Sales (All Customers) link under PIPELINE in the top navigation bar. The Lost Sales page displays.
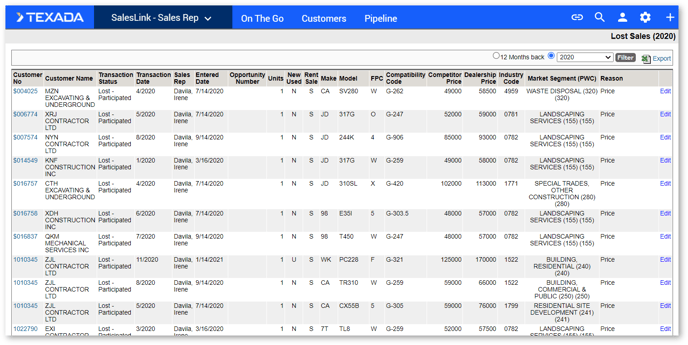
This page displays a detailed table of all sales you lost over the past 12 months. Switch the year of lost sales displayed in the table by selecting a year from the drop-down menu at the top of the page, then click [Filter].
Export the table into an Excel spreadsheet by clicking the [Export] button at the top right of the page.
To edit a lost sale:
- Click the [Edit] button next to the lost sale you want to edit.
- Edit any information in the Lost Sale form.
- Click [Save] to save the edits, or [Delete] to delete the lost sale.
All Lost Sales (All Models and Reps)
Click the All Lost Sales (All Models and Reps) link under PIPELINE in the top navigation bar. The Lost Sales by Model – All Regions page displays.
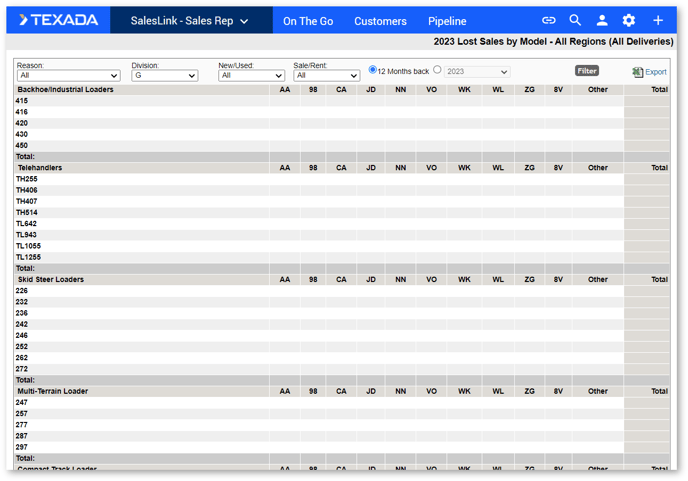
This page displays a detailed table of all lost sales, organized by equipment model. Use the drop-down menus at the top of the page to filter the table. The table will automatically update as each filter selection is made.
Export the table into an Excel spreadsheet by clicking the [Export] button at the top right of the page.
Click on a number in the table to view details regarding the lost sale(s).
Latest Work Orders
Click the Latest Work Orders link under PIPELINE in the top navigation bar. The Latest Work Orders page displays.
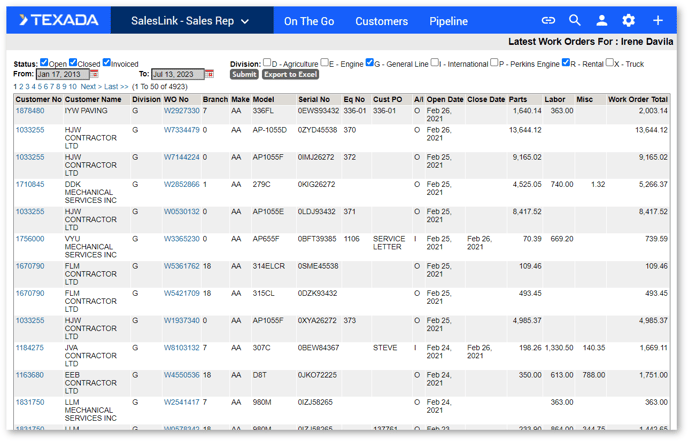
This page displays a detailed table of all your work orders, organized by most recently opened date.
To filter the table:
- Select the fields to filter by at the top of the page.
- Select a date range.
- Click the [Submit] button.
Export the table into an Excel spreadsheet by clicking the [Export] button at the top right of the page.
Click on a Work Order Number to view details regarding that work order.