.png?width=365&height=50&name=Texada%20Logo%20(Black).png)
Key Indicator Dashboard
If the Key Indicator Dashboard is not set as the Home page it can be accessed by clicking the Dashboard link under ON THE GO in the top navigation bar.
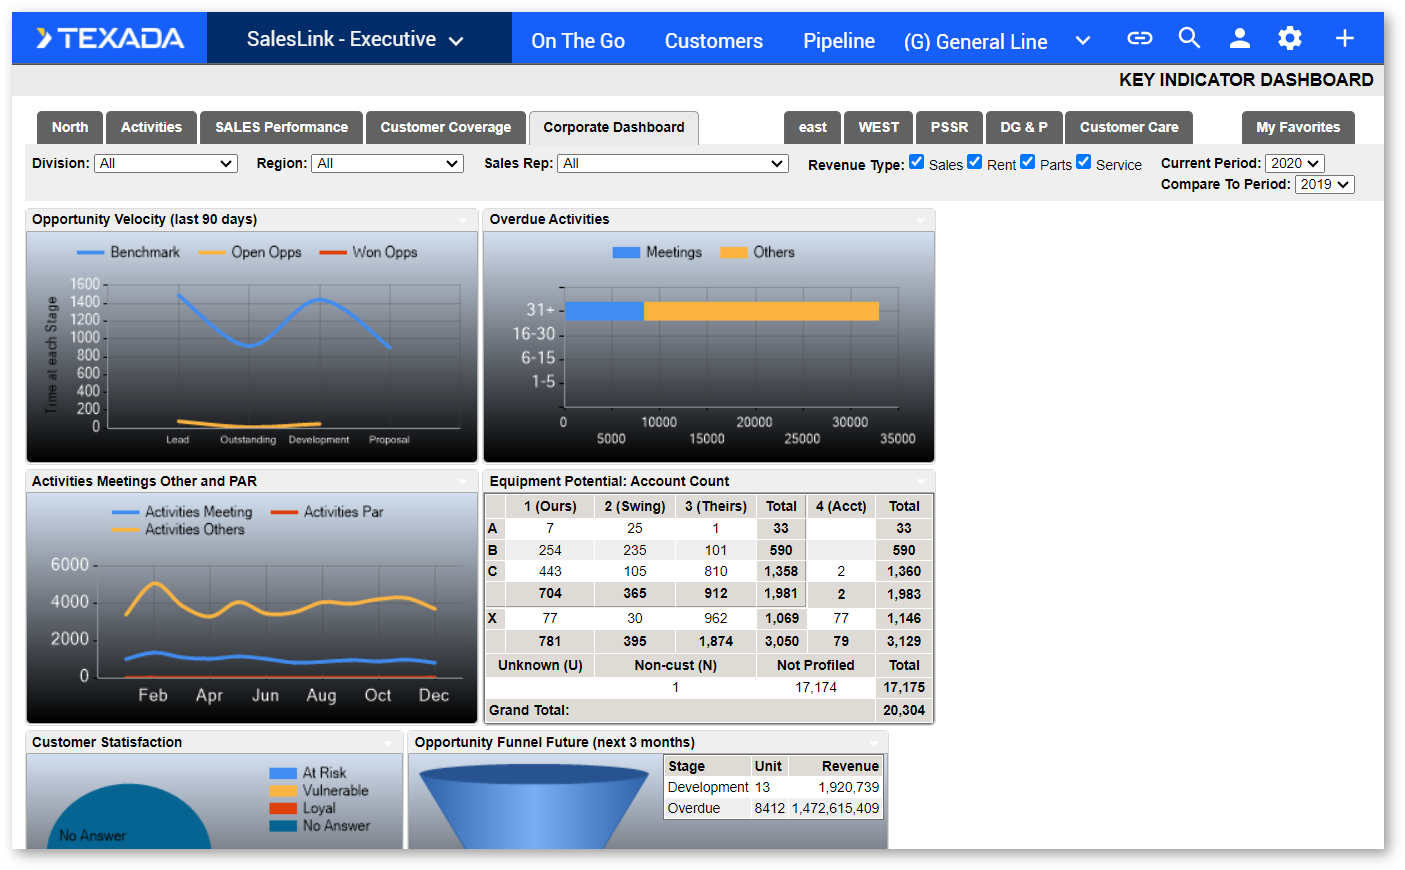
Toggle between dashboards by clicking on the tabs at the top of the page. Each dashboard displays different widgets containing valuable at-a-glance information.
To filter the widgets:
- Select the fields you want to filter by at the top of the page.
- Select the year you want to filter from.
The widgets will automatically update as filters are applied.
Widgets:
- Conversion Rate – A history bar graph showing win/loss units and conversion rate percentage. Extended view to show total as is currently displayed in units and revenue.
- Customer Satisfaction – Survey results from CSM as At Risk, Vulnerable, and Loyal ratio per month.
- Sales Projection – Displays three months back and six months forward. Toggle between estimated delivery month and order month for future opportunities (or have 2 widgets). Extended view should display satisfaction by question category.
- PSSR Reps – Parts widget and Service widget to display revenue
- MSR – Sales widget to display units
- RSR – Rental widget to display units
- Executive – All widgets
- Open Opportunities – Shows the number of OPEN opportunities (machine quantities) in SalesLink for the corresponding estimated decision (CLOSE) month.
- Cumulative Future Deliveries – Shows the number of machines in SalesLink where the status is set as WON. This is effectively a cumulative future projection of machine deliveries for deals where orders are secured.
- Budget Business Plan – Financial year budget (number of units). This is the FY target to meet/exceed and against which progressive performance is monitored.
- Cumulative YTD deliveries – Shows the number of machines in SalesLink where the status is set as WON and the estimated date of delivery has passed.
- Potential Business Plan – Considers cumulative wins plus open opportunities divided by the sales funnel ratio. This gives a projection of where the actual business plan could be, based on the quantity of opportunities and current win closure rate.
- Parts Opportunity – Displays three months back and six months forward. Displays delivery month for won opportunities. Displays revenue as a stacked bar by commodity.
- PTOS History – Displays Parts actual sales, predicted PTOS sales, and Reps won opportunities for the last six months by dollar volume. The expanded view shows four columns: Commodity, Market size, Actual sales, and Won opportunities.
- Opportunity Funnel – Displays open Opps at Qualification, Development, and Proposal stages for the next three months and an indicator number for unknowns (overdue).
- Activities – Displays three lines: Meetings, Others, and a PAR line calculated from the total of all PAR's in primary division divided by 12. Graph displays six months of history and next 30 days of future dated activities.
- Overdue Activities – Displays stacked bar showing two categories (Meetings and Others). The extended count should show two columns displaying the count for each category.
- Change Request – Displays six months on a graph showing all change requests submitted and an indicator for uncompleted follow-up requests. The expanded view should display type of request on the left and the six-month total for each category in the column.
Add to My Favorites
- Click the down arrow at the top right corner of the widget you want to add to the My Favorites dashboard.
- Select My Favorites under Add to Dashboards.
You can add as many widgets as you want to create a personalized My Favorites dashboard. To remove a widget, click the X next to the down arrow at the top right.
Extended View
To display an Extended View of a widget, click the down arrow and select Extended View under Views, or click anywhere inside the body of the widget.

The Extended View contains the same information as the original widget, along with a more detailed description and links related to the source data (if available).