.png?width=365&height=50&name=Texada%20Logo%20(Black).png)
Sales Performance Summary
Click the Sales Performance Summary link under PIPELINE in the top navigation bar. The Performance Summary – MSR page displays.

This page displays a detailed table of MSR sales information for all regions over the past year. The numbers appearing in green and red are being compared to the company average. Green represents above-average performance, red represents under-average performance. A number in black represents the company average.
Use the filters at the top of the page to view Enabled and Disabled reps, or change the Year and Division displayed in the table.
Export the table into an Excel spreadsheet by clicking the [Export] button at the top right of the page.
Equipment Sales Budget
Click the Equipment Sales Budget link under PIPELINE in the top navigation bar. The Equipment Summary Report page displays.

This page displays a detailed table of information regarding all revenue generated and accounts assigned across all regions. Use the drop-down menus at the top of the page to filter the table by Year, Month, Managers, or Division.
Click on a manager’s name to view their region’s budget details.
Export the table into an Excel spreadsheet by clicking the [Export] button at the top right of the page.
Parts and Service Performance Summary
Click the Parts and Service Performance Summary link under PIPELINE in the top navigation bar. The Performance Summary page displays.
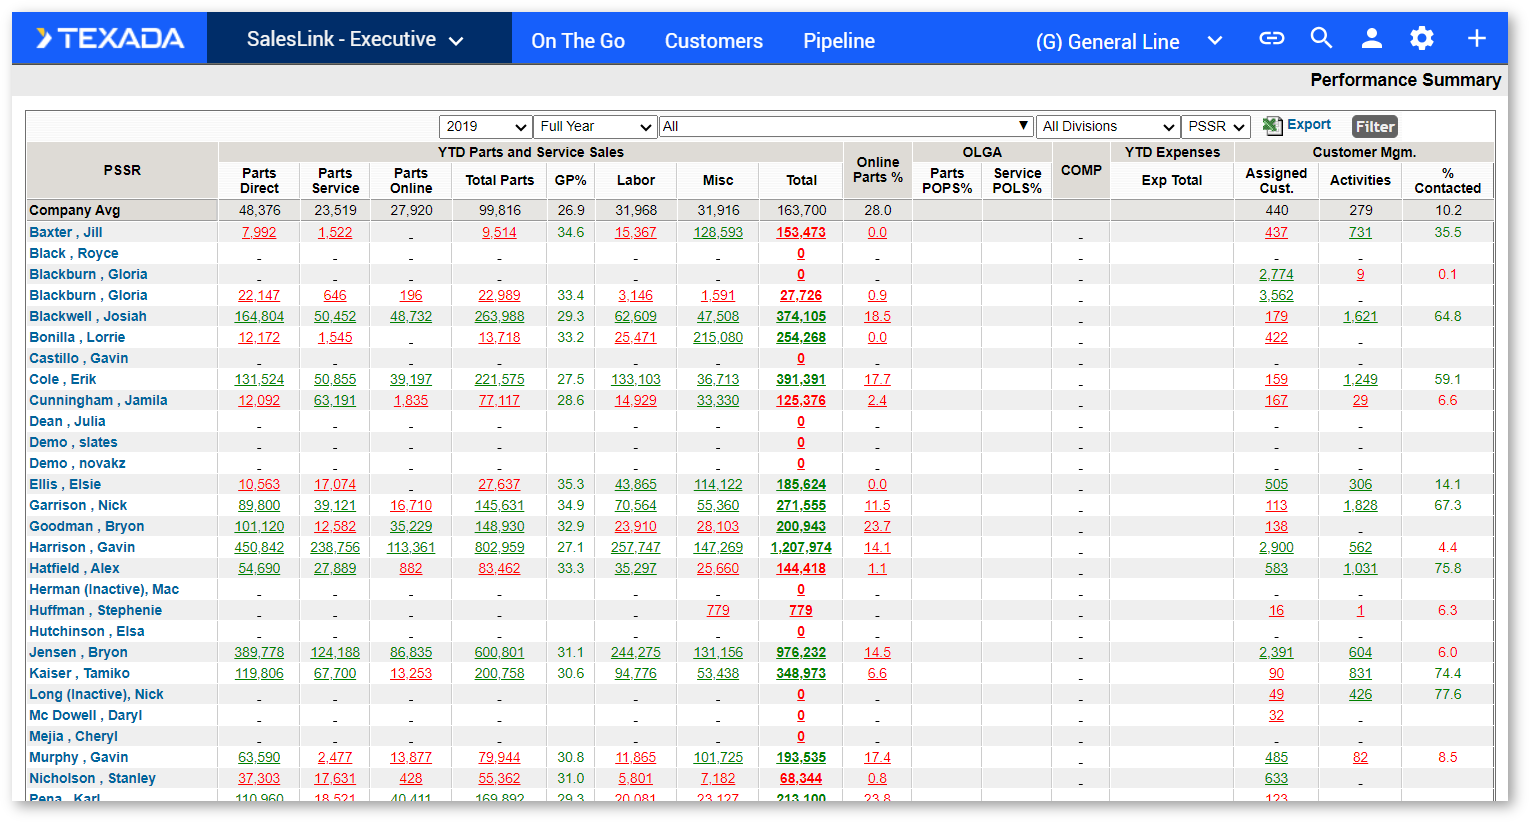
This page displays a detailed table of PSSR sales information for all regions over the past year. Performance as compared to company average is indicated in green and red. Green represents above-average performance, red represents under-average performance. A number in black represents the company average.
Use the filters at the top of the page to view a different Year, Quarter, Month, Region, or Division.
Export the table into an Excel spreadsheet by clicking the [Export] button at the top right of the page.
Parts & Service Sales Budget
Click the Parts & Service Sales Budget link under PIPELINE in the top navigation bar. The Parts & Service Sales Budget page displays.
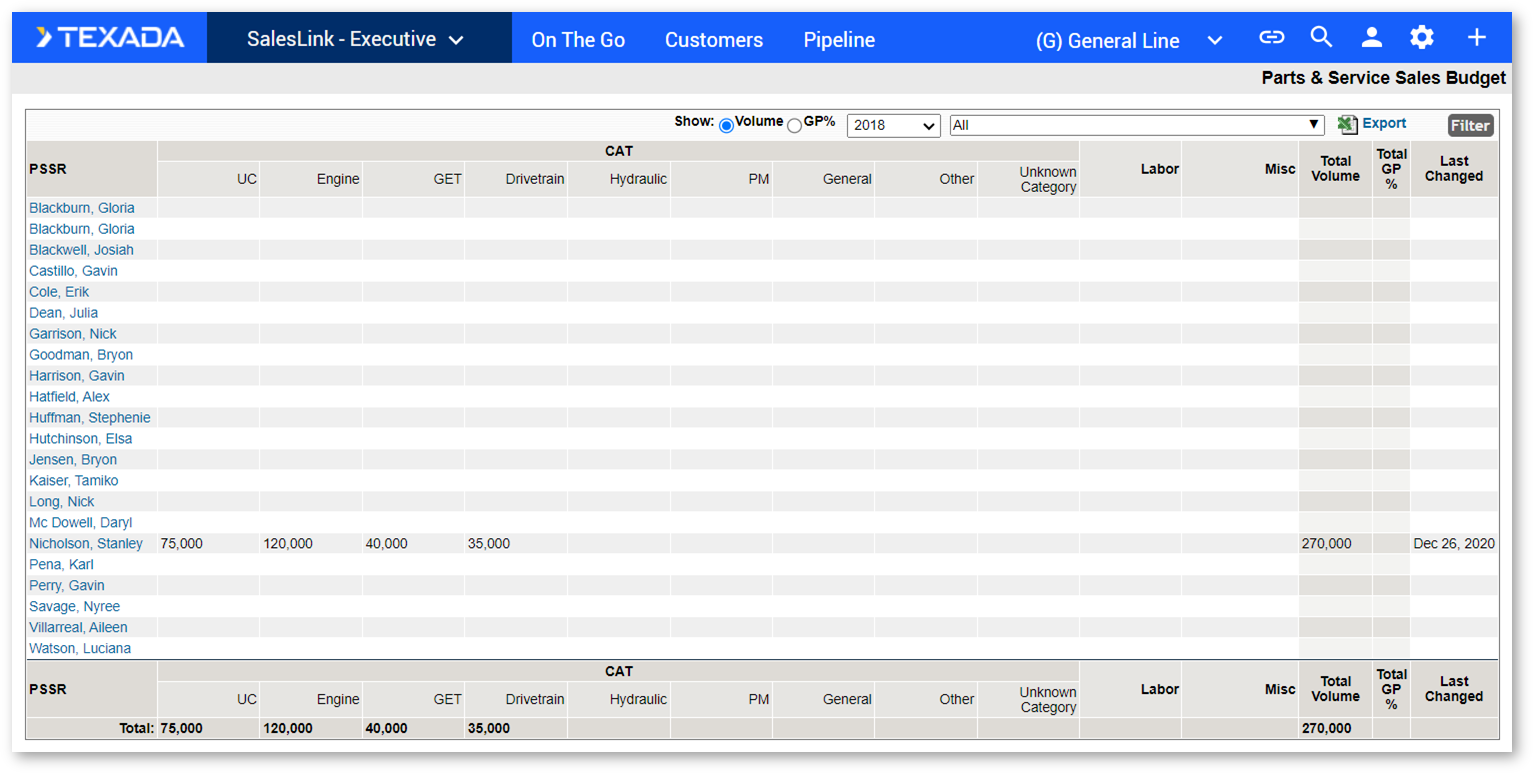
This page displays a detailed table of information regarding PSSR revenue generated across all regions. Use the filters at the top of the page to display Volume, GP%, or a different Year or Region.
Click on a manager’s name to view their region’s PSSR budget.
Export the table into an Excel spreadsheet by clicking the [Export] button at the top right of the page.
Lost Sales by Region
Click the Lost Sales by Region link under PIPELINE in the top navigation bar. The Lost Sales by Region page displays.

This page displays a table of all lost sales over the current year, organized by region. Click on a number in the table to view/edit details of the lost sales for a specific region.
Use the drop-down menus at the top of the page to filter the table by Reason, New/Used, or Year.
Export the table into an Excel spreadsheet by clicking the [Export] button at the top right of the page.
Lost Sales by Model (All)
Click the Lost Sales by Model (All) link under PIPELINE in the top navigation bar. The Lost Sales by Model – All Regions (All Deliveries) page displays.

This page displays a detailed table of all lost sales, organized by equipment model. Use the drop-down menus at the top of the page to filter the table. The table will automatically update as each filter selection is made.
Export the table into an Excel spreadsheet by clicking the [Export] button at the top right of the page.
Click on a number in the table to view details regarding the lost sale(s).
Lost Sales From UCC
Click the Lost Sales From UCC link under PIPELINE in the top navigation bar. The Lost Sales From UCC – By Sales Rep page displays.
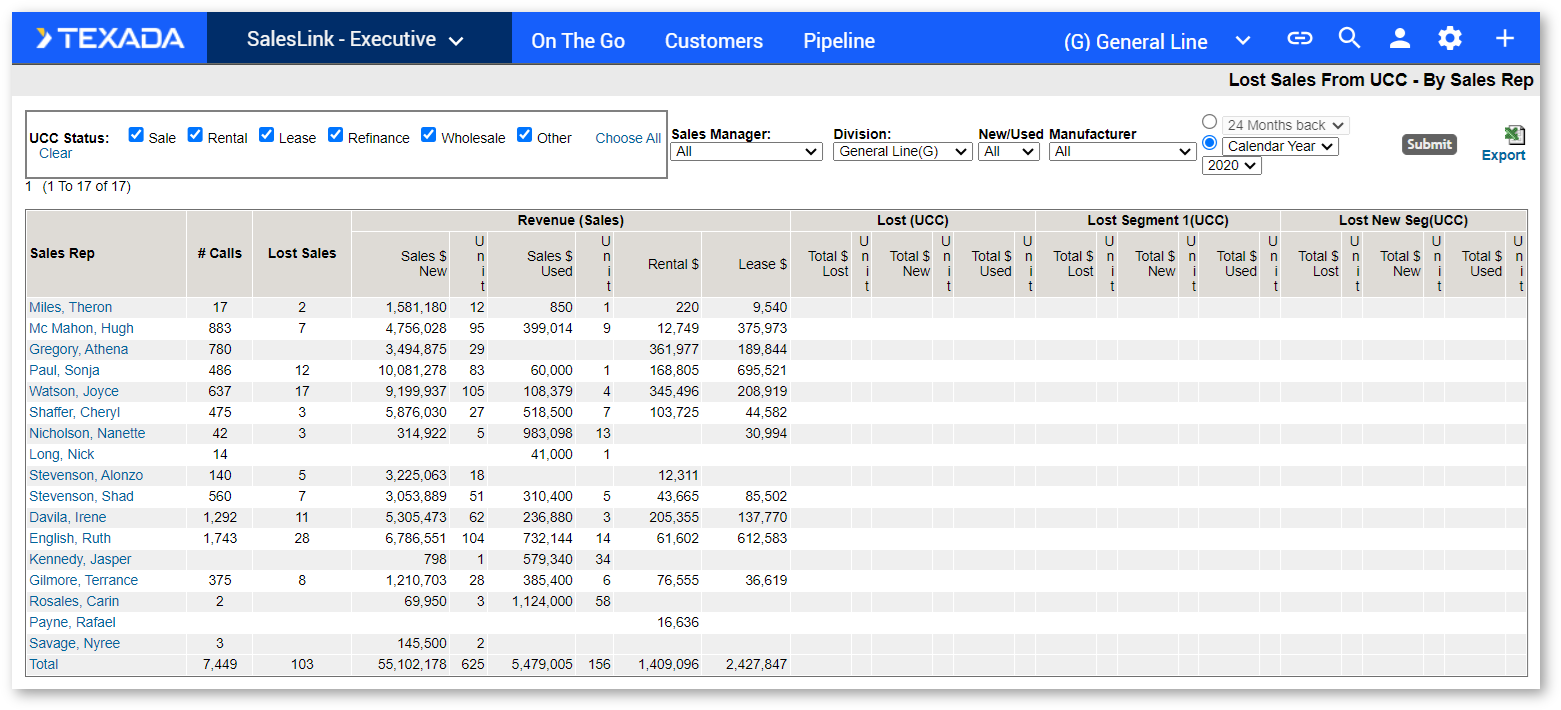
This page displays a detailed table of information comparing each region’s total Revenue to how much they Lost from UCC. Click on a manager’s name to view only their specific region’s information.
To filter the table:
- Select the fields to filter by at the top of the page.
- Click the [Submit] button.
Export the table into an Excel spreadsheet by clicking the [Export] button at the top right of the page.
Add Lost Sales
To add a lost sale:
- Click the Plus icon at the far right of the top navigation bar.
- Select [Add Lost Sales] from the drop-down menu.
- Click the magnifying glass icon and search for a customer.
- Select a division for the customer.
- Enter all required information into the Lost Sales form.
- Click the [Save] button to enter the lost sale.
Latest Work Orders
Click the Latest Work Orders link under PIPELINE in the top navigation bar. The Latest Work Orders page displays.

This page displays a detailed table of all currently open work orders, organized by region.
To filter the table:
- Select the fields to filter by at the top of the page.
- Click the [Submit] button.
Export the table into an Excel spreadsheet by clicking the [Export] button at the top right of the page.
Click on a number in the table to view details regarding that sales rep’s work orders.
CAT CSS
Click the CAT CSS link under PIPELINE in the top navigation bar. The CAT CSS page displays.

The table on this page displays your currently outstanding transactions. Click the [Edit] button to edit the details of a transaction.
To filter the table:
- Select the fields to filter by at the top of the page.
- Click the [Filter] button.
Once you’ve made all necessary edits and filtered out transactions you don’t need, check the Select Upload box next to all transactions you want to send to CAT. Click the [Create New Batch] button to upload the transaction. Your batch will then appear in the Uploaded Transactions section. Any transactions that were designated as Not Applicable will appear in the Not Applicable Transactions sections.
Export the table into an Excel spreadsheet by clicking the [Export] button at the top right of the page.