.png?width=365&height=50&name=Texada%20Logo%20(Black).png)
Introduction
Welcome to ServiceLink. To access the application, log in to CloudLink with your Username and Password, then click the [ENTER] button under ServiceLink. You will be taken to the ServiceLink Home page.

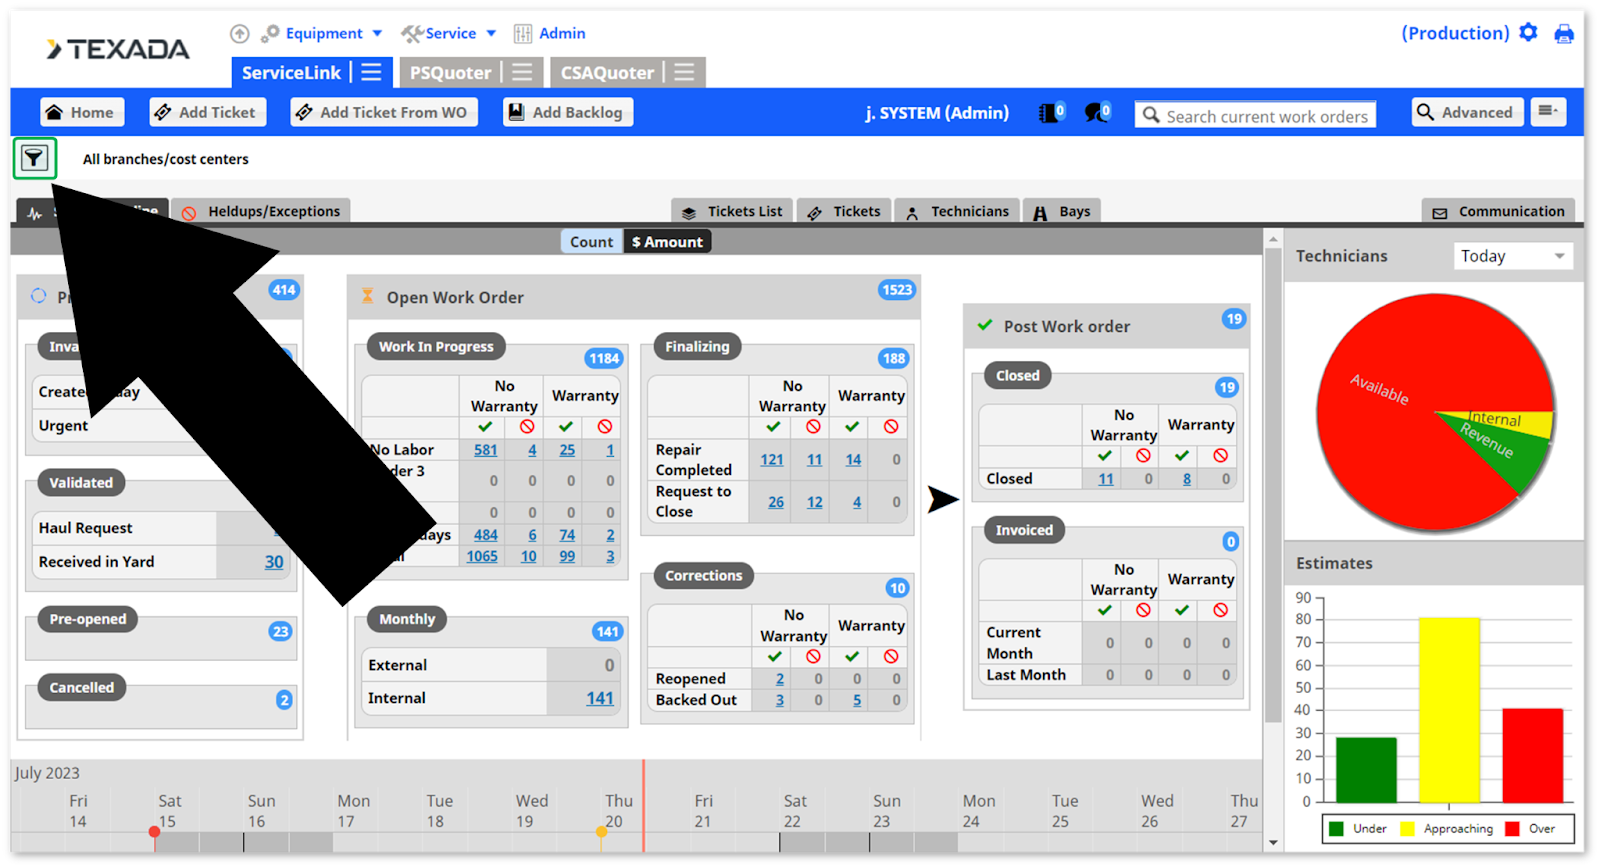
The Home page shown here is the Service Pipeline page. However, your Home page may be different depending on your user role.
The key to the Home page is the filter button in the top-left corner of the page. This button allows you to filter for your own Division, Branch and Cost Center.
Navigation
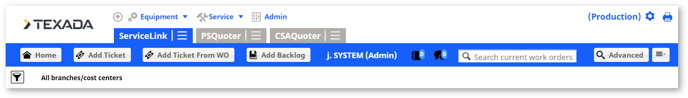
Access the navigation bar at the top of your screen at any time in ServiceLink. At the top left of the navigation are links to other CloudLink applications you may have access to.
|
|
Click the Menu icon next to ServiceLink to access the different pages within ServiceLink. |
|
|
Click the Gear icon to access your other CloudLink applications, as well as your preferences and ServiceLink copyright information. |
|
|
Click the Printer icon to generate a PDF of the current page, which can then be saved or emailed. |
|
|
Click the Home button to navigate to the home page. |
|
|
Click the Add Ticket or Add Ticket From WO buttons to create a new ticket. |
|
|
Click the Add Backlog button to add a backlog from anywhere in ServiceLink. |
|
|
Click the Blog icon to access any available blogs. |
|
|
Use the Search bar next to the Blog icon to search for work orders/tickets. A minimum of three characters are required to begin searching. |
|
|
Click the Advanced Search icon to refine your searches using more detailed filters. |
|
|
Click the Recently Viewed icon next to Advanced Search to display the last 15 tickets you have viewed. |
|
|
Click the Filter icon to select which Branch/Cost Center information is displayed. |
Home Page
Service Pipeline
The main feature of ServiceLink’s Home page is the Service Pipeline. The Service Pipeline gives you visibility into all the work that is currently in progress. Tickets begin on the left side of the Pipeline and move to the right as the repair is completed.
- Click on any of the blue hyperlink counts to view the list of work orders contributing to that total.
- Click on any of the the BLUE pill counts to view the list of work orders for easy view and sorting.

The following are statuses in the Service Pipeline.
Pre-Work Order
-
- Invalidated
Tickets that are automatically generated by the dealership ERP and by other CloudLink applications (including Parts and Service Quoter, Equipment Monitoring Toolkit, and the Condition Monitoring Portal). These tickets remain Invalidated until reviewed by the responsible supervisor and changed to Validated. - Validated
Tickets that have been reviewed by the responsible supervisor and changed to Validated. Manually created tickets can be set automatically to Validated. - Pre-Opened
Work orders from your ERP system that were previously created and are in Estimate status. - Canceled
Tickets that have been Canceled by the responsible supervisor.
- Invalidated
Open Work Order
- Work In Progress
Work order tickets that have been created in the ERP and are currently being worked on. - Monthly
Work orders that automatically close, invoice, and reopen each month. - Finalizing
Work orders that have been completed and are waiting to be reviewed by the responsible supervisor. - Corrections
Work orders that have been backed out or reopened.
Post Work Order
- Closed
Work orders that have been completed and closed but not yet invoiced. - Invoiced
Work orders that have been completed and closed and have had invoices sent out.
Technicians
%20SHADOW.png?width=230&height=242&name=Technicians%20(Home%20Page)%20SHADOW.png)
The Technicians pie chart represents the state of the technician schedule for the current day. Technicians scheduled to work on a Revenue customer work order will be represented in Green, technicians scheduled to work on an internal work order will be Yellow, technicians not available to be redeployed will be Grey, and technicians not scheduled or available to be redeployed will be Red.
Click the drop-down arrow to display the state of the technician schedule for tomorrow. Click on any of the chart’s sections to see the Scheduler view for those technicians and tickets.
Estimates

The Estimates bar chart represents the number of tickets that are below, approaching, and exceeding the financial estimate. Click on any of the bars to see the Scheduler view for those technicians and tickets.
Timeline

The Timeline displays the Promise Dates and Estimated Arrival Dates of tickets. Promise Dates are represented by an alarm clock icon: green for approaching, yellow for within three days (before or after), and red for past the date. The blue road icon indicates a bay that as been scheduled for a work order (these remain blue throughout the timeline).
Add Ticket
To manually add a new ticket (to create a work order):
- Click the [Add Ticket] button in the top navigation bar.
- Use the Search bar to search for a piece of equipment. A minimum of three characters are required to begin searching.
- Use the tabs at the top of the search screen to filter your results. You can also use the Eye icon at the top right to customize which columns of information are displayed.
- If both the customer and equipment information is correct, click the Person-and-gear icon to the left to create a ticket with that information. If only the customer information is correct, click the Person icon. If only the equipment information is correct, click the Gear icon.
- If neither the customer nor equipment information is correct, click the [Create empty Ticket] button at the top of the screen to create a blank ticket.
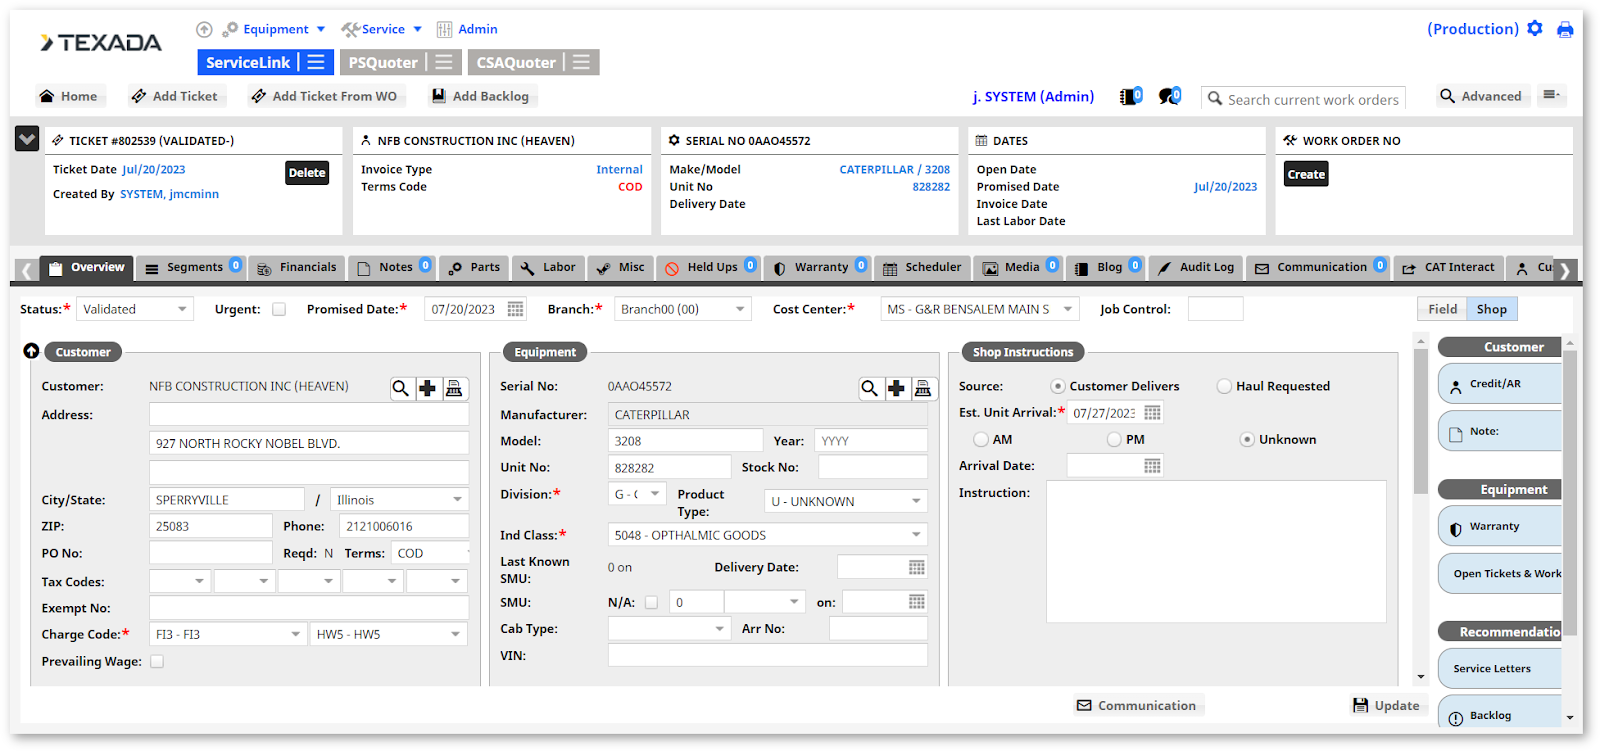
- Enter all required information into the Ticket Overview fields. Note that any customer or equipment information you deemed correct is automatically filled in.
- Enter Shop Instructions information if the ticket is for a shop, or click the [Field] button at the top of the page to enter Job Site information if the work will take place in the field.
- Use the tabs at the right of the page to view/add any Customer, Equipment, and Recommendation information to the ticket.
- Enter Contact information and set the frequency and method of communication.
- Click the Plus icon in the Symptom section, then enter all required information into the New Symptom form. Click [Save] to save the new symptom.
- Click [Update] at the bottom right of the page to create the ticket.
- Click the Segments tab, then click [New Segment]. The New Segment form will display.
- You can add a new segment from a Template, Work Order, Standard Job, DBS Documents, or Manually.
- Enter all required fields, then click [Create]. Add as many segments as needed.
- Click the [Open] button at the top right of the page to open the work order. Note that all required fields must be entered, segments added, and the status set to Validated before the button will appear.


The other tabs in the Work Order page are outlined throughout the rest of this user guide.