.png?width=365&height=50&name=Texada%20Logo%20(Black).png)
Alerts Review Summary
The Alerts Review Summary (also accessible by clicking the tab at the top of the page) displays the trends of alerts over a selected time range. Alerts are plotted separately by status (AR, MC, and NAR).

Alerts Received

The Alerts Received chart displays the number of alerts of each status received over the selected time range.
Alerts Reviewed
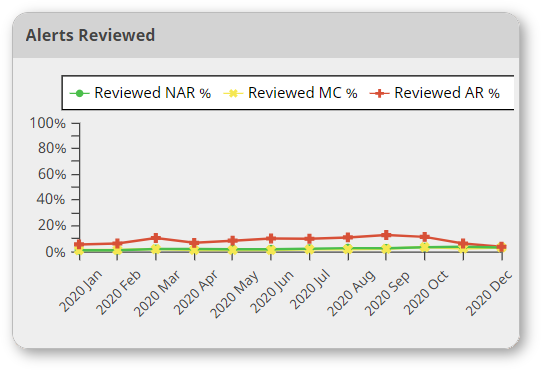
The Alerts Reviewed chart displays the percentage of alerts of each status reviewed over the selected time range.
Red Alerts Review Timing

The Red Alerts Review Timing chart displays the percentage of red alerts taking more than a specified amount of time to review.
- Green: Reviewed within one day
- Yellow: Reviewed within one week
- Red: Reviewed after one week
Alerts Review Summary
The Alerts Review Summary table combines the three charts (Alerts Received, Alerts Reviewed, and Red Alerts Review Timing) into one table.

Click on an alert number in the Alerts Review Summary to navigate to the Alerts table and view details about those alerts.
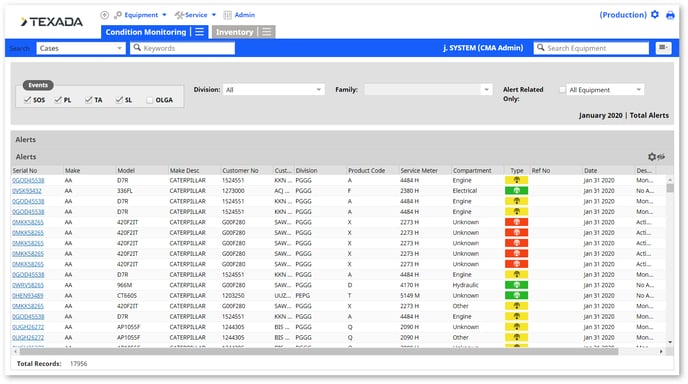
The Alerts table displays information about the equipment in which the alert occurred including serial number, make, model, customer information, type, description, and status.
The icons in the Type column represent the following:
 (flask) – Oil Samples
(page) – Inspections
 (antenna) – Electronic Data
 (envelope) – Service Letters
The icons in the Status column represent the following:
(speaker with a slash) – Silenced
 (hourglass) – Outstanding
(checkmark) – Reviewed
Click on a serial number to view detailed information on that equipment. See the EquipmentLink section for more details.