
An overview of the Health screens in CloudLink Console - Current Status, Uptime Report, Current Performance Status, and Performance Report.
Quick Reference
- CloudLink Console provides administrators with a number of tools useful for monitoring the health of the CloudLink system. To reach these tools, open CloudLink Console and look under Health in the left side menu:
- Current Status: Provides an overview of the current status of each of CloudLink’s modules.
- Uptime Report: Shows the system’s uptime for each month, both in total and on a per-module basis.
- Current Performance Status: Provides an overview of CloudLink’s current performance, both in total and on a per-module basis.
- Performance Report: Allows you to track the system’s per-module performance over time.
Introduction
CloudLink Console provides administrators with a number of tools useful for monitoring the health of the CloudLink system. The following article will provide an overview of the screens available under the “Health” menu option in CloudLink Console.
Status Key
The screens described in the article below share a three-tiered status system for tracking the health of CloudLink’s various modules. The three possible statuses for each module are as follows:
|
Status |
Significance (Current Status and Uptime Report) |
Significance (Current Performance Status and Performance Report) |
|
|
The module is currently available. |
The module is performing well. |
|
|
The module is experiencing partial disruptions. |
The module is experiencing minor slowdowns. |
|
|
The module is currently unavailable. |
The module is experiencing significant slowdowns. |
Current Status
This screen provides you with an overview of the current status of each of CloudLink’s modules.
To reach this screen, open CloudLink Console and navigate to Health → Current Status in the left side menu.
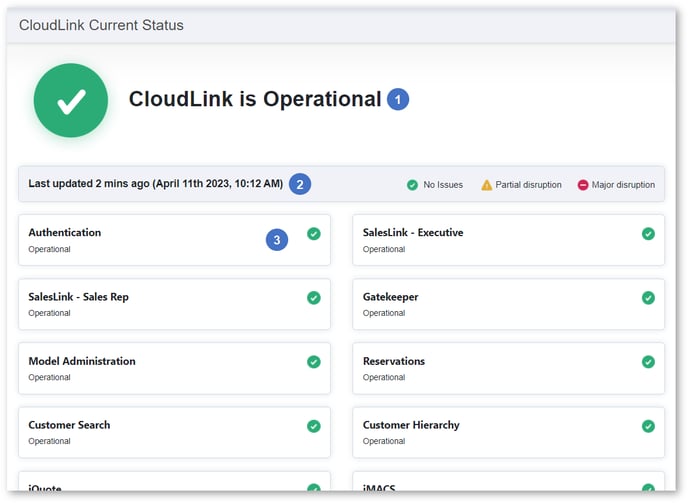
- Overall Status
The overall status of CloudLink. - Last Updated Time
The date and time at which the diagnostics on this screen were last updated. Diagnostics are automatically updated every 3 minutes. - Status by Module
The current status of each of CloudLink’s modules.
Uptime Report
This screen allows you to review the system’s uptime for each month, both in total and on a per-module basis. A system’s uptime for a given period is defined as the percentage of time during which the system was operational throughout that period. For example, if a system experienced a 5-minute outage during a 24-hour period, the system’s uptime for that period would be 99.65% (1435 min / 1440 min * 100).
To reach this screen, open CloudLink Console and navigate to Health → Uptime Report in the left side menu.
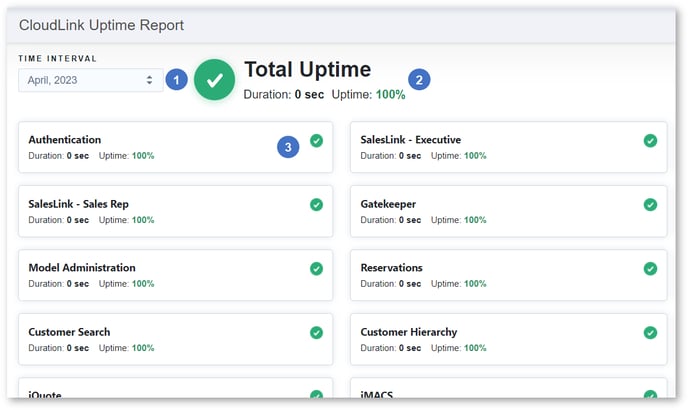
- Time Internal
The month for which you are viewing uptime. Select a different month from the drop-down list to view it. - Total Uptime
The total uptime for the system during the select period. “Duration” indicates the amount of downtime detected during this period, in seconds. “Uptime” indicates the ratio of downtime to uptime, with 100% indicating no downtime for the selected period. - Uptime by Module
The uptime of each module for the selected period.
Current Performance Status
This feature is currently in beta and may not be available to all users.
This screen provides you with an overview of CloudLink’s current performance, both in total and on a per-module basis.
Unlike the Current Status screen, which tracks the system’s availability per module, this screen tracks the system’s performance - in other words, the speed and reliability with which each module can be accessed. This performance is measured using the 3 Core Web Vitals established by Google Chrome’s development team.
To reach this screen, open CloudLink Console and navigate to Health → Current Performance Status in the left side menu.
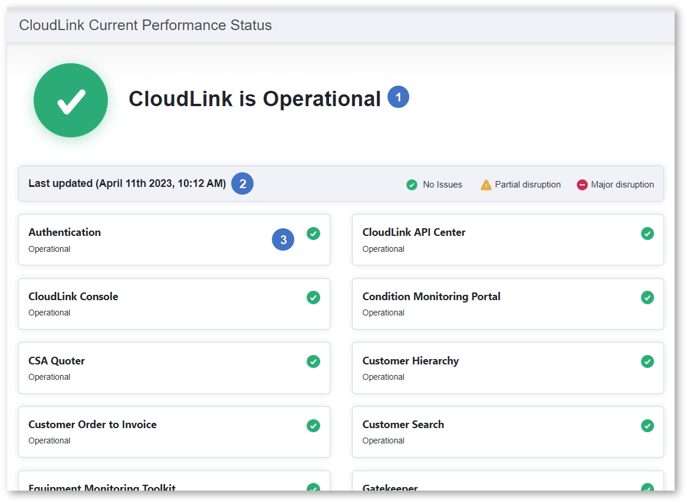
- Overall Performance Status
The overall status of CloudLink. - Last Updated Time
The date and time at which the diagnostics on this screen were last updated. Diagnostics are automatically updated every 3 minutes. - Performance Status by Module
The performance status of each module. Note that, because this tool tracks performance instead of availability, a status of “Partial disruption” or “Major disruption” does not necessarily indicate that the module is unavailable - rather, it indicates that the module is performing slower than expected.
Performance Report
This feature is currently in beta and may not be available to all users.
This screen allows you to track the system’s per-module performance over time. It can be considered an historic version of the Current Performance Status screen.
To reach this screen, open CloudLink Console and navigate to Health → Performance Report in the left side menu.
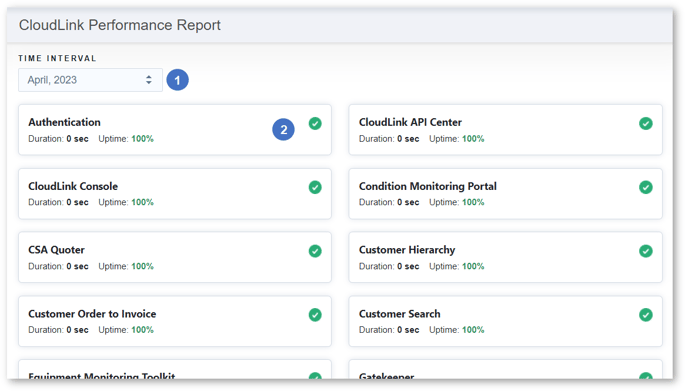
- Time Interval
The month for which you are viewing performance. Select a different month from the drop-down list to view it. - Performance by Module
The performance of each module for the selected period. “Duration” indicates the amount of downtime detected during this period, in seconds. “Uptime” indicates the ratio of downtime to uptime, with 100% indicating no downtime for the selected period. “Downtime”, in this context, means periods of poor performance as opposed to periods of unavailability. Any time spent in a status of “Partial disruption” or “Major disruption” will be counted as downtime for the purposes of this metric.