.png?width=365&height=50&name=Texada%20Logo%20(Black).png)
Quick Reference
- Texada Analytics is a report visualization and development tool powered by Microsoft Power BI.
- There are three separate Power BI applications:
- Power BI Desktop: A desktop application targeted at advanced users that allows the creation of new reports.
- Power BI Service: A cloud-based application available at app.powerbi.com. The primary method of accessing Texada Analytics for most users.
- Power BI for Mobile: Mobile applications that allow users to view reports from their Android or iOS devices.
Introduction
Texada Analytics is an in-platform, integrated solution for report visualization and development. It delivers interactive insights from Texada SRM as well as other data sources.
Texada Analytics is powered by Microsoft Power BI. Most of the functionality of Power BI is available through Texada Analytics, plus the ability to connect automatically to SRM data and be guaranteed regular refreshes of your data.
Application Structure
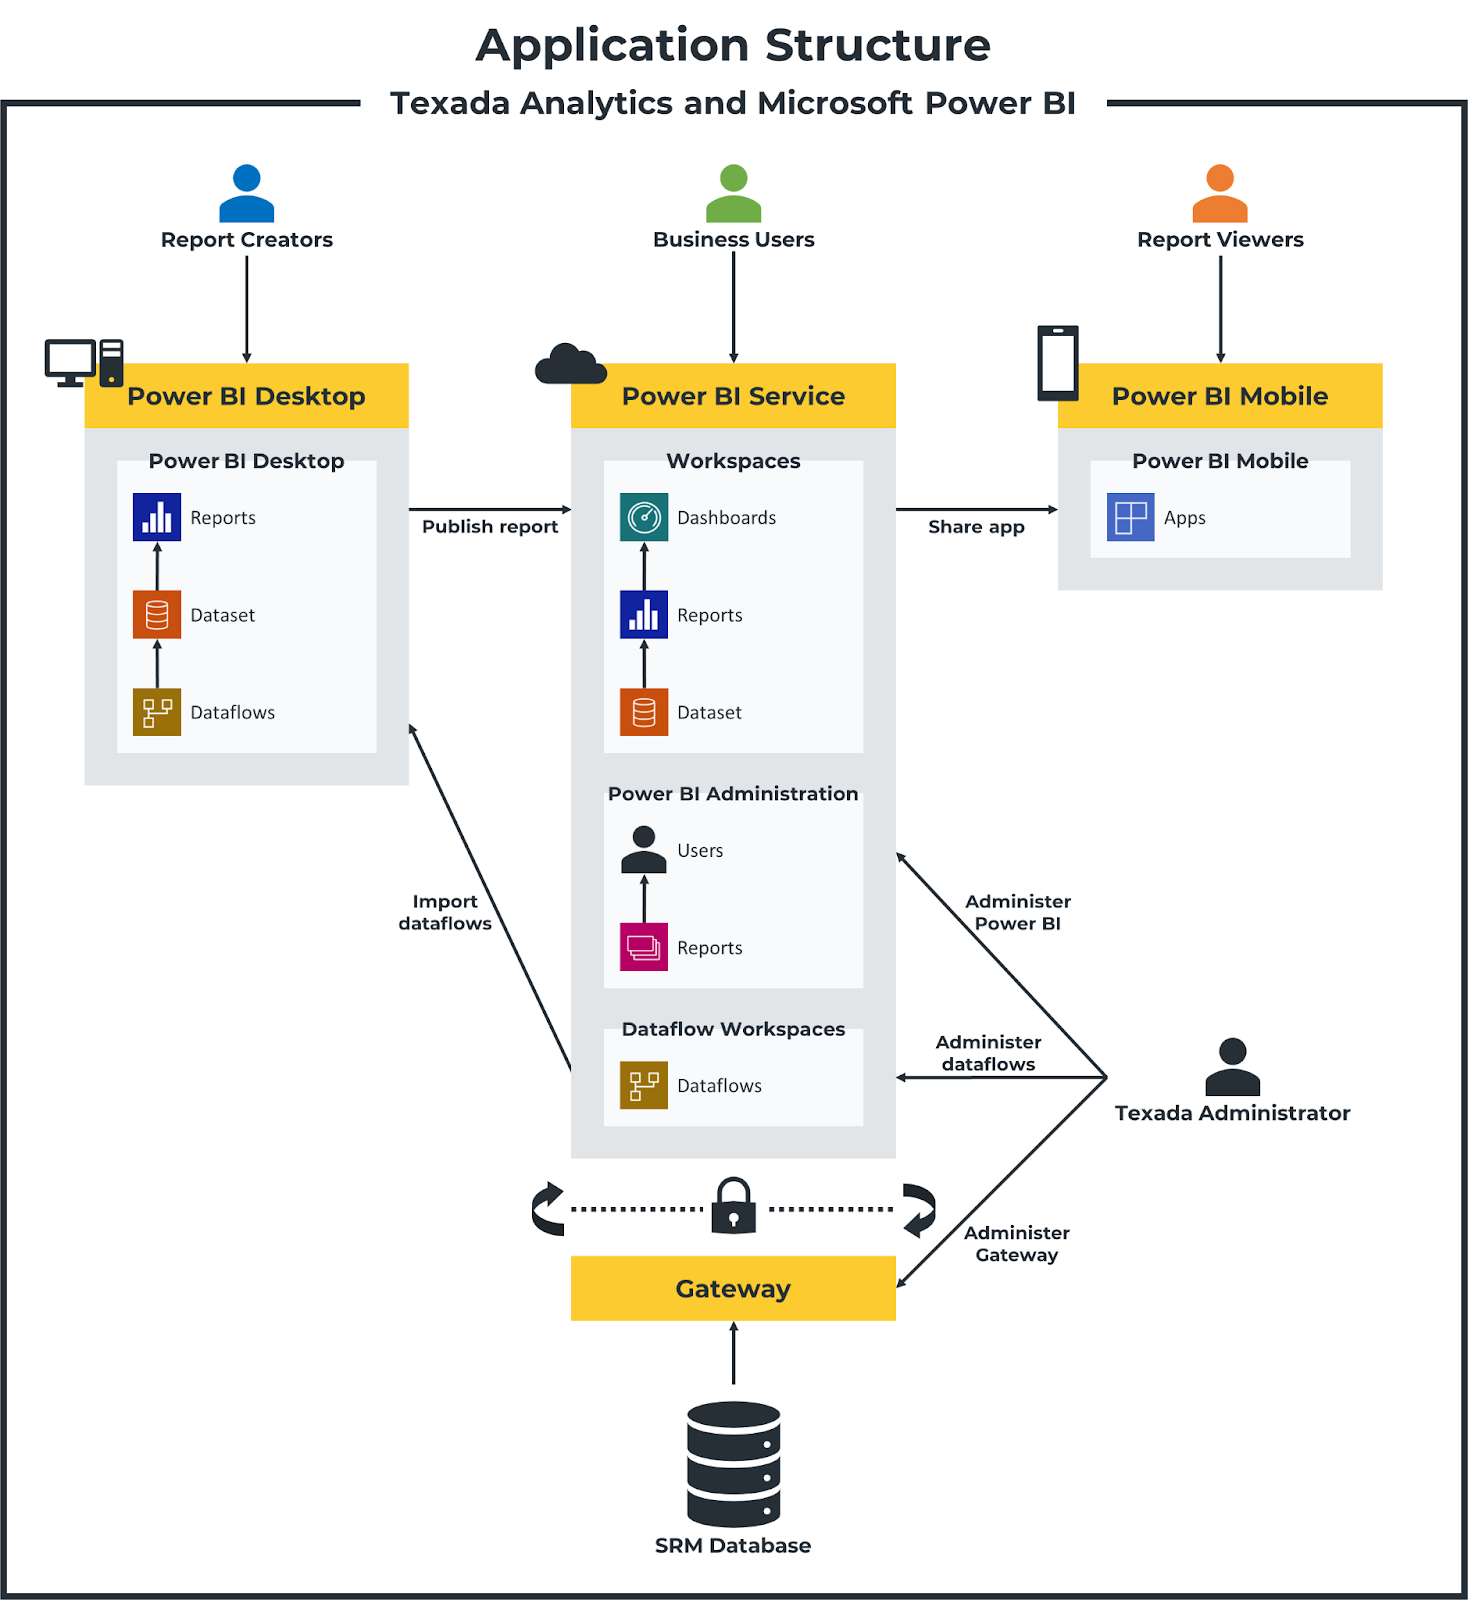
There are three separate Power BI applications: Power BI Desktop, Power BI Service, and Power BI for Mobile. The way users interact with these components will depend on each user’s role.
- Power BI Desktop
A desktop application directed at advanced Power BI users which can be used to create and share new reports. - Power BI Service
A cloud version of Power BI available at app.powerbi.com. This is an in-browser tool that does not require installation and is accessible from any device. This will be the primary method of accessing and modifying Texada Analytics for most users. - Power BI for Mobile
Mobile applications that allow you to view the reports and dashboards available in the Power BI Service from your Android or iOS device.