
- Texada Knowledge Base
- Rental Asset Management
- WorkFlow for Web
-
Top Searched Articles
-
Product Updates
-
Support & Troubleshooting
-
Onboarding Programs
-
Equipment CRM
-
Service Management
-
SRM
-
Handle
-
Analytics
-
E-Commerce
- Getting Started
- New Administration Panel
- Administration Panel
- Administration Panel - CMS
- Administration Panel - Products, Categories, and Attributes
- Administration Panel - Users
- Administration Panel - Requests
- Customer Access Portal
- Customer Access Portal - Rentals
- Customer Access Portal - Invoices
- eCommerce Websites
- eCommerce Websites - Ordering
- Integrations
-
Texada Mobile
-
Payments
-
Texada Web
-
Rental Asset Management
-
Order Fulfillment
-
Power Systems Projects
-
Equipment Quoting
-
Condition Monitoring Portal
-
Equipment Monitoring Toolkit
-
Parts and Service Quoting
-
Service Agreement Quoting
-
Equipment CRM - Additional Tools
Working with Tables in Texada WorkFlow
Everything you need to know about working with the data tables found throughout Texada WorkFlow.
Quick Reference
- Data tables are a common feature of Processes throughout Texada WorkFlow.
- Tips for navigating tables:
- Use the controls at the top of the table to navigate between pages and select the number of results per page.
- Click on a column’s header to sort the table’s contents by that column.
- Click on a row in a table to select it. This will have a different effect depending on the table in question.
- Additional options for each row, such as edit and delete buttons, can often be found near the left or right sides of the table.
Introduction
Appearing in a number of Processes throughout Texada WorkFlow, tables serve as windows into the data behind your system. While no two tables are exactly alike, many of them share features in common. The following article will provide an overview of these features.
Elements of a Table
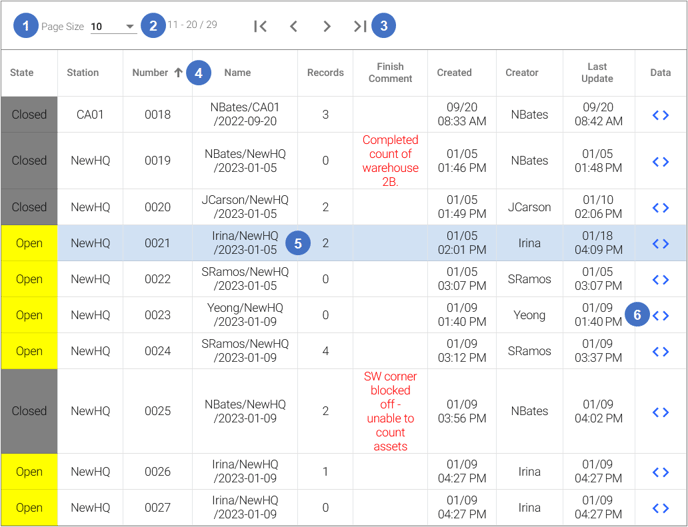
- Page Size Selector
Use this drop-down to select the number of results displayed on each page of the table, up to a maximum of 100. - Current Records
The numbers next to the page size selector indicate which records are currently being displayed, as well as the total number of records. In the example above, records 11 to 20 are currently visible out of a total of 29. - Navigation Arrows
These arrows allow you to navigate the table. Use the left and right
  arrows to display the previous or next page, respectively. Use the left stop
  and right stop
  arrows to jump to the first or last page, respectively.
 - Column Headers
Click on a column’s header to sort the contents of the table by that column. There are three sorting options: ascending (up arrow ), descending (down arrow
  ), and no sort (no arrow). Note that some columns do not support sorting.
 - Row
Click on a row in a table to select it. This will have a different effect depending on the table in question. For example, selecting an inventory batch in the Inventory Process will display the contents of that batch in the nearby Items table.
Some tables, such as the Work Orders table in the Asset Planning Process, feature a draggable area near the left side of each row. This draggable area is indicated by a dark blue cell color and six vertical dots: . Click and drag the row from this location for various effects depending on the Process in question.
 - Row Options
Many tables feature additional options for each row, available near the left or right side of the table. These options are different for each table. Common options include:
|
Option |
Icon |
Effect |
|
Data |
|
Click to view the row’s contents as raw data. Useful for troubleshooting purposes. |
|
Edit |
|
Click to edit the contents of the row. |
|
Delete |
|
Click to delete the row. |
|
Navigate |
|
Click to open the address associated with the row in Google Maps. |